
最新刊期
卷 29 , 期 12 , 2025
- “日光诱导叶绿素荧光SIF是植物光合作用监测的关键指标,对陆地生态系统碳水循环监测意义重大。近年来,随着“星—空—地”荧光遥感技术的综合发展,SIF遥感反演取得了显著进展。”
 摘要:Sun-induced chlorophyll fluorescence (SIF) is a weak spectral signal emitted by chlorophyll under solar radiation and can directly reflect the process of vegetation photosynthesis. It serves as a critical remote sensing indicator for accurately monitoring vegetation productivity and the carbon–water cycle of terrestrial ecosystems. In recent years, with the gradual improvement of the space–air–ground multilevel fluorescence remote sensing observation system, SIF retrieval techniques have achieved rapid progress in terms of algorithms, instruments, observation platforms, and product development, showing high application potential in vegetation photosynthesis monitoring, carbon cycle assessment, and global change research.Existing reviews on SIF retrieval mostly focus on specific aspects, such as algorithms or instruments, and lack a systematic synthesis of recent developments in algorithms, equipment, platforms, and products. Over the past five years, substantial progress has been achieved in algorithm improvements and product applications, but a comprehensive review summarizing and critically analyzing these advances is still lacking. To address this gap, this study presents a comprehensive review of the current status and progress of research on SIF retrieval.Specifically, the study traces the historical development of SIF retrieval since its first successful implementation in 1975 and introduces multiple categories of retrieval algorithms on the basis of different principles. These algorithms include physics-based approaches (e.g., Fraunhofer line discrimination), empirical and statistical methods (e.g., singular value decomposition), and emerging machine learning techniques. In addition, this study systematically introduces SIF retrieval methods that are based on 1D (homogeneous canopies) and 3D (heterogeneous canopies) radiative transfer models. For each category, the theoretical basis, technical characteristics, strengths, and limitations are analyzed.This study further summarizes the representative instruments, observation platforms, and major products of SIF retrieval and reviews theoretical and practical achievements from recent multiplatform (ground, airborne, and satellite) and multiscale observations. For ground-based platforms, we provide a systematic overview of observation instruments (e.g., Fraunhofer line radiometer) and automated monitoring systems (e.g., hyperspectral IR radiometer). For airborne platforms, we describe the instrumentation characteristics of aircraft- (e.g., reflective optics system imaging spectrometer) and UAV-based (e.g., six-band multispectral camera) observation systems. For satellite platforms, we review the development of the first spaceborne SIF retrieval mapping, which was achieved in 2007 by using the medium-resolution imaging spectrometer onboard the Environmental Satellite , and summarize the major SIF products that have been generated to date. In addition, methods for assessing retrieval uncertainties are briefly introduced, and six key issues (e.g., atmospheric effect) affecting SIF retrieval accuracy are identified and discussed with reference to existing literature. On the basis of these analyses, the study further evaluates the challenges currently faced by the field and outlines potential directions for future development.In summary, this study systematically synthesizes the progress of research on SIF retrieval from the perspectives of algorithms, instruments, platforms, and products and provides a comprehensive overview of achievements and limitations. The review aims to serve as a useful reference for domestic and international studies and promote the extensive application of SIF in carbon cycle assessment, gross primary production estimation, climate change research, and ecosystem monitoring.关键词:SIF;remote sensing retrieval;remote sensing instruments;estimation methods;ecological monitoring;multi-platform;Carbon-water cycle581|509|0更新时间:2026-02-09
Review

- “介绍了覆膜农田遥感分类研究进展,专家梳理了利用遥感技术监测覆膜农田的研究现状,为解决农膜污染问题提供数据支持。”
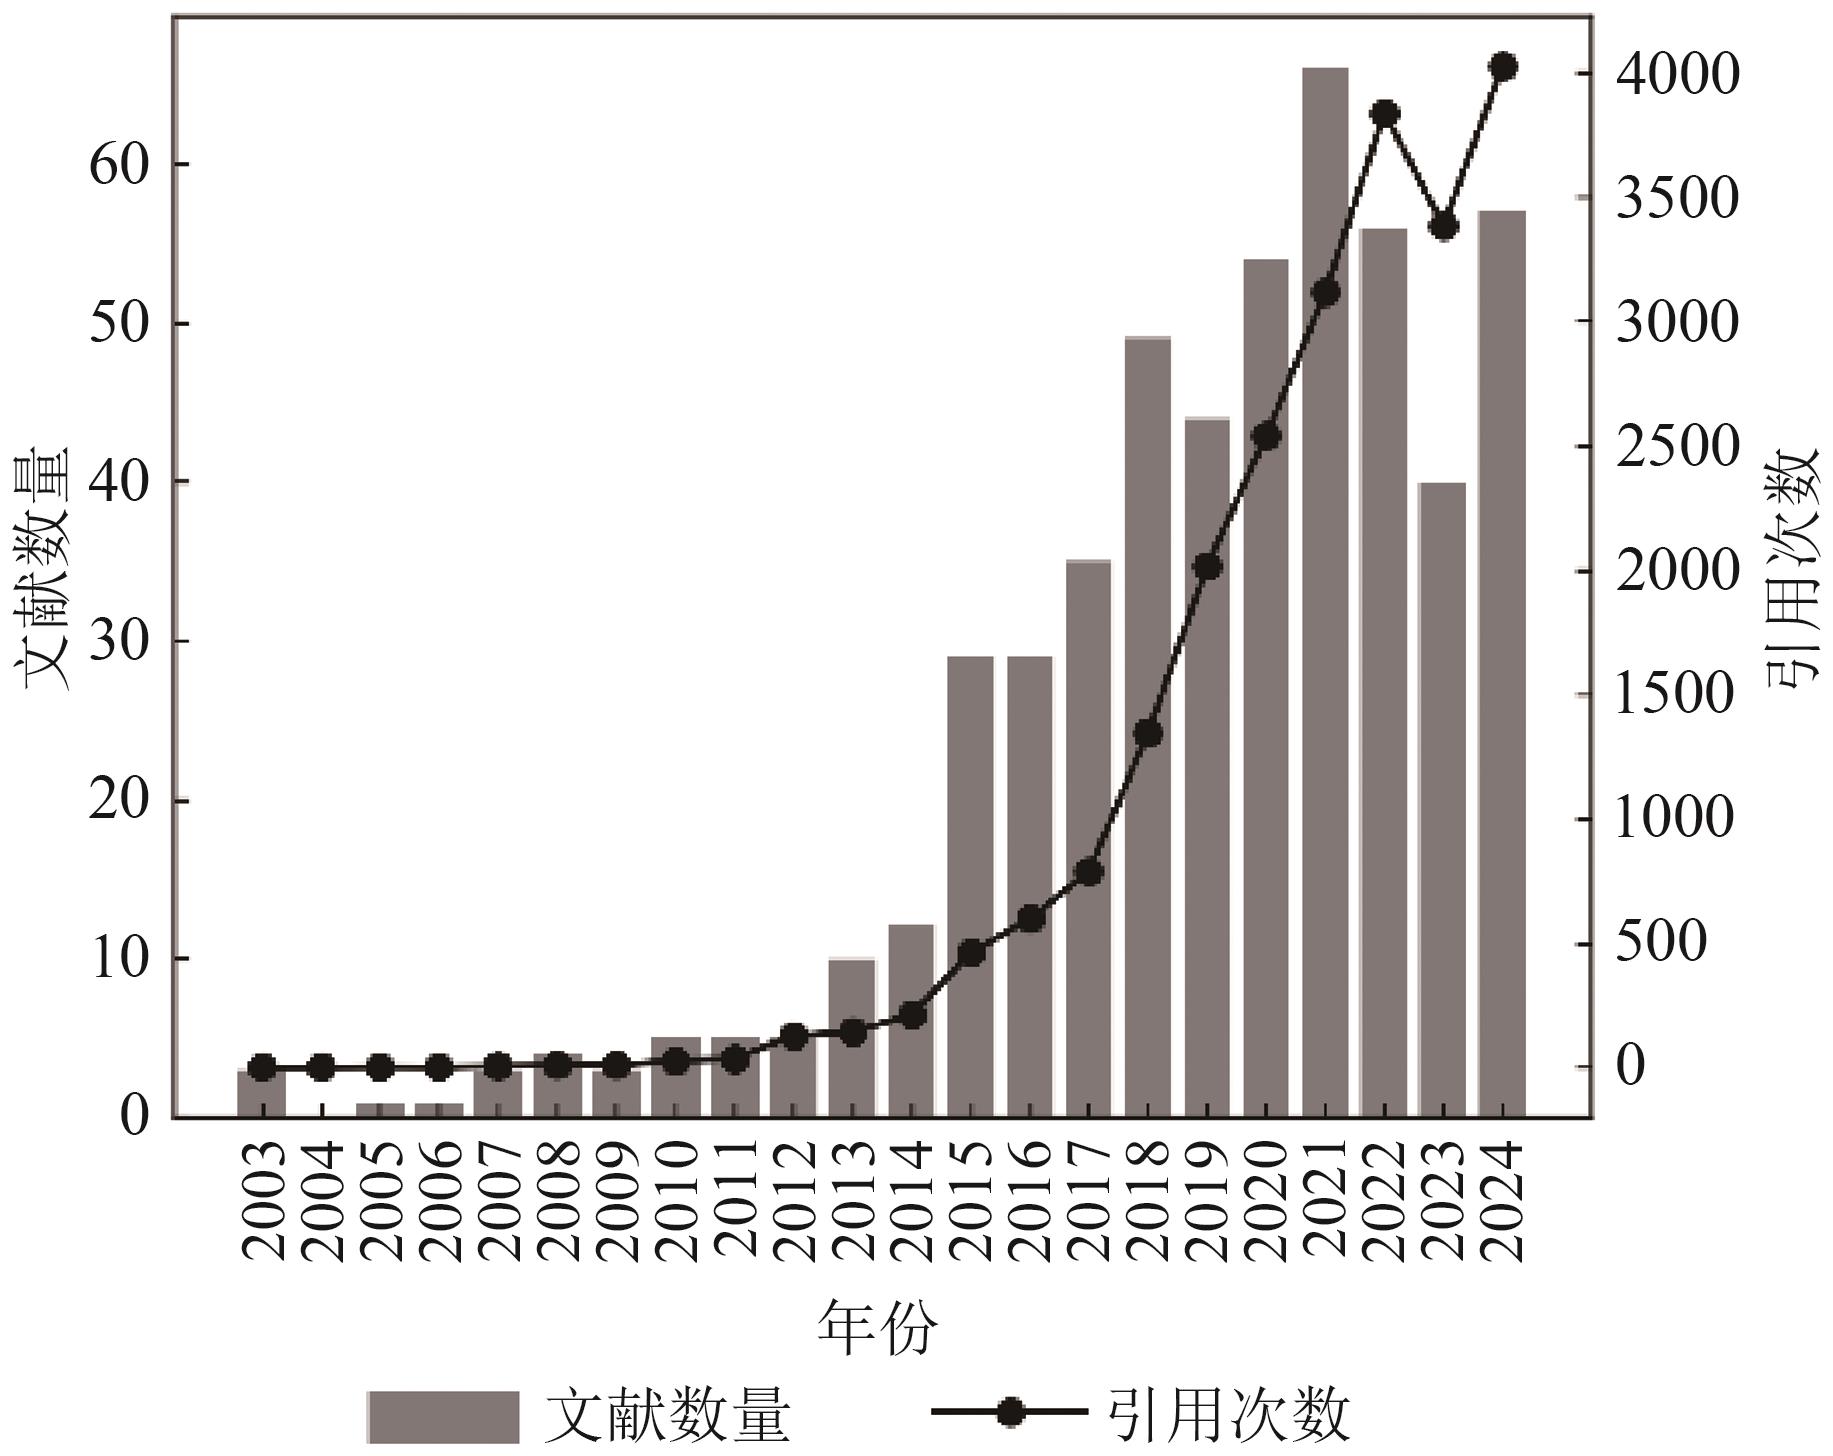
 摘要:Plastic film mulching provides substantial agronomic benefits, such as thermal insulation, moisture conservation, weed suppression, and yield enhancement. However, it has led to increasingly severe agricultural plastic pollution. Remote sensing technology enables accurate acquisition of spatiotemporal distribution data for plastic-mulched farmland at large scales. It provides essential support for black soil conservation and agricultural environmental improvement. This study systematically reviews and analyzes the current status of remote sensing identification and classification for plastic-mulched farmland. The analysis focuses on four key aspects: remote sensing data sources, feature extraction techniques, classification methods, and information fusion approaches. It also summarizes the challenges in the remote sensing identification and classification of plastic-mulched farmland while outlining future trends and research directions. The findings provide valuable references for advancing monitoring in this field. This study uses bibliometric methods to systematically analyze the progress of research on remote sensing identification and classification of plastic-mulched farmland. Primary data sources include the China National Knowledge Infrastructure and Web of Science, with the analysis covering publications from 1980 to 2023. The research focuses on comparative analysis across four critical dimensions: remote sensing data characteristics, feature extraction techniques, classification algorithms, and information fusion technologies. Medium-resolution satellite data are extensively used for remote sensing data sources. High-resolution satellite imagery exhibits superior performance in plastic film contour recognition. UAV remote sensing demonstrates notable advantages in localized monitoring, and integrating optical and microwave data improves classification accuracy. Among spectral indices, the plastic-mulched land cover index and GDI are particularly effective in greenhouse identification. In feature extraction, spectral features are the predominant research focus. Texture features enhance identification accuracy for extensively distributed and highly clustered greenhouses. However, they show limited improvement for small, fragmented areas. In addition, multitemporal feature fusion effectively distinguishes plastic mulch from greenhouses. Among classification algorithms, machine learning methods are most widely adopted, followed by deep learning approaches. Convolutional neural networks demonstrate outstanding performance in semantic segmentation tasks. Remote sensing offers advantages in large-scale, high-frequency data acquisition. However, traditional monitoring methods remain indispensable because of their precision and accuracy. The primary challenge is effectively integrating remote sensing with conventional monitoring to address the limitations of both. Doing so can enhance the precision, efficiency, and applicability of agricultural monitoring systems. Moreover, deep integration of remote sensing and artificial intelligence can provide robust support for precision agriculture. Classifying ground objects with similar spectral characteristics often causes spectral confusion, but combining novel spectral indices and multisource data fusion methods effectively addresses such confusion. Although deep learning methods exhibit superior classification performance, they face challenges, such as high computational costs, extensive training data requirements, and demanding hardware specifications. Strategically adopting data augmentation, transfer learning, model compression, multiresolution fusion, and lightweight architectures can optimize computational efficiency and promote extensive application in remote sensing classification. In conclusion, this work summarizes the issues and challenges in remote sensing identification and classification of plastic-mulched farmland. It also outlines future trends and research directions, providing references for advancing monitoring technologies in this field.关键词:plastic film;plastic film pollution;multi-source remote sensing;feature extraction;image classification352|331|0更新时间:2026-02-09
Research Progress
- “介绍了其在风能资源评估领域的研究进展,相关专家通过多源数据匹配分析,验证了MULOWV卫星融合风场产品的高精度和多源一致性,为风场监测和模型评估提供了可靠数据源。”
 摘要:On the basis of multisource ocean dynamic satellite observations of sea surface wind fields in China, the National Satellite Ocean Application Service has developed a high-quality Level-4 global sea surface wind field fusion product (Multisatellite Ocean Wind Vector, MULOWV). As a novel wind field dataset, MULOWV integrates the strengths of multiple data sources, offering potential utilization in wind speed and wind direction measurements. However, its reliability and performance in practical applications remain to be validated. To assess the application potential of MULOWV, this study conducts detailed comparisons and evaluations of METOP and moored buoy observations. Furthermore, triple collocation analysis is performed to calibrate and assess the biases, scaling factors, and random errors among the three datasets, revealing their consistency and providing a reliable basis for multisource data fusion and optimization.To ensure spatial and temporal consistency between satellite observations and in situ measurements, this study defines appropriate spatiotemporal collocation windows on the basis of satellite spatial resolution and the variability of sea surface winds. Through triple collocation analysis, unbiased error estimates are derived for each dataset, enabling the assessment of errors and systematic biases without requiring a reference truth. Standard deviation, mean bias error, Root-Mean-Square Error (RMSE), and correlation coefficient are selected as evaluation metrics. These indicators are applied to wind speed and wind direction and analyzed from an overall perspective and across different wind speed regimes.Results show that in comparison with BUOY and METOP data, MULOWV data exhibit small biases, with wind speed RMSE below 1.6 m/s and wind direction RMSE below 15°. MULOWV demonstrates high consistency and stability in collocations and strong adaptability for large-scale and multisource validation needs. In the triple collocation analysis, buoy data serve as the baseline reference, providing critical guidance for calibrating MULOWV and METOP; however, buoy data exhibit large random errors in low-wind-speed conditions, suggesting the need for joint calibration with other sources. Across the wind speed regimes, data quality varies. MULOWV and METOP show strong overall correlations, but slight deviations occur under extreme-wind conditions. Under moderate-to-high wind speeds, MULOWV achieves good random error characteristics and bias corrections, demonstrating high consistency and accuracy, making it suitable for use as a primary data source for high-precision wind field monitoring and model validation.In conclusion, the MULOWV fusion product provides high accuracy and strong multisource consistency, supporting its use as a major data source for wind field monitoring and model evaluation. MULOWV is applicable for large-scale wind field estimation, but for high-precision applications, multisource integration is still needed to enhance reliability. Buoy data remain suitable for use as calibration references in localized regions. By applying triple collocation analysis to wind speed and direction, this study provides valuable insights for wind field monitoring and model validation under diverse conditions. Future efforts should focus on improving stability under extreme-wind scenarios to enhance MULOWV’s applicability in complex atmospheric environments.关键词:Ocean Satellite;Blended Sea Surface Wind Field;Triple Collocation Analysis;MULOWV;microwave scatterometer;Wind Field Validation228|273|0更新时间:2026-02-09
 - “中国海洋一号卫星搭载的海洋水色水温扫描仪,可实现公里级全球海洋水色监测。专家基于2165组实测数据,构建了多层感知器神经网络模型,实现全球水体叶绿素a浓度高精度反演,为海洋生态监测提供创新方法。”
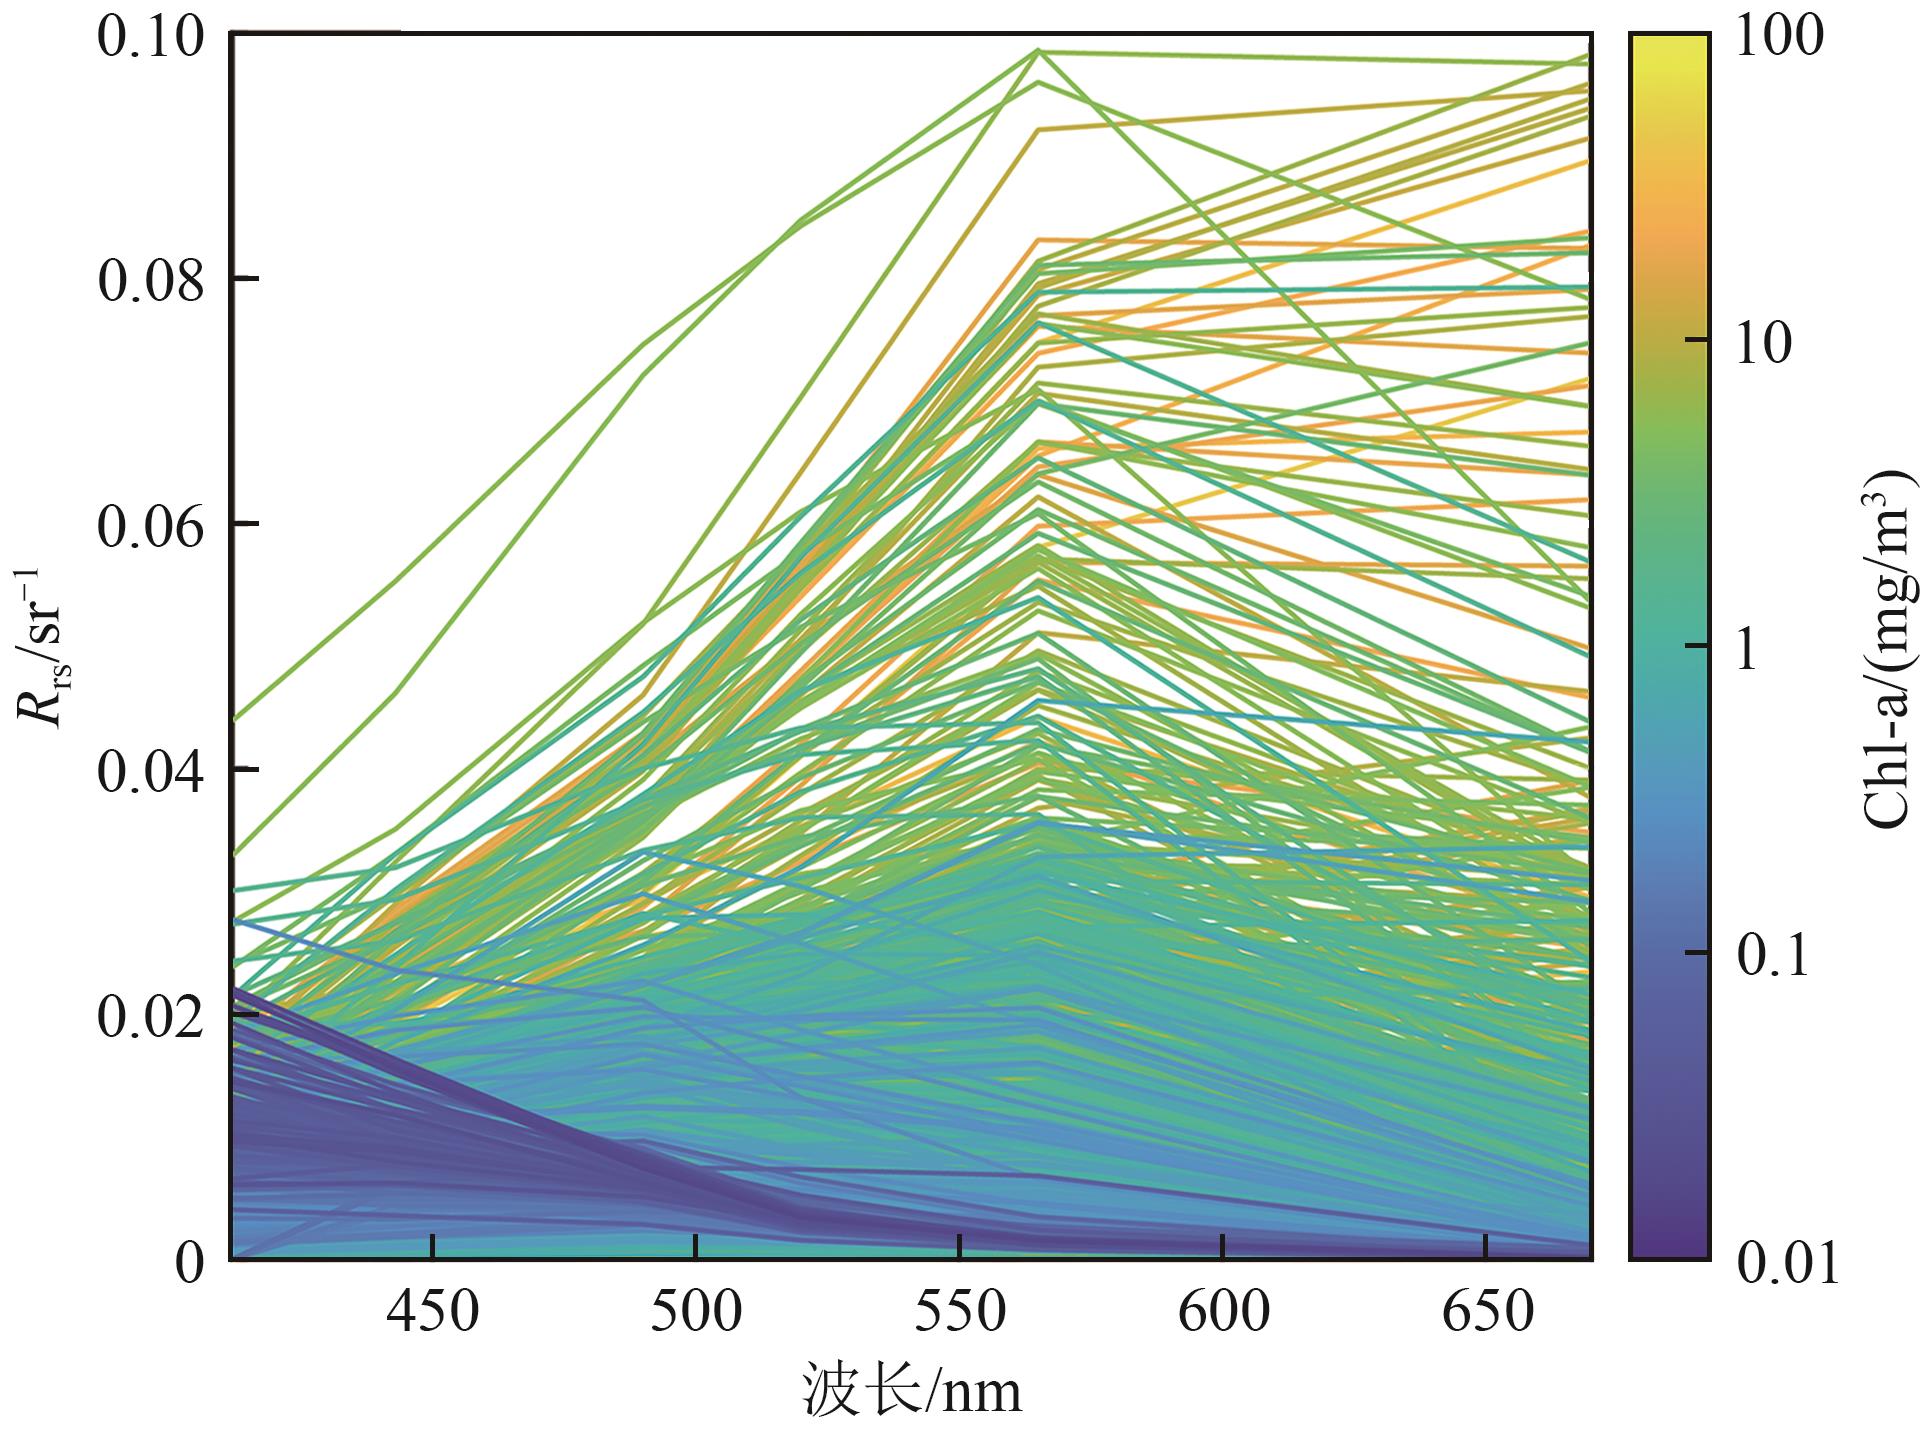 摘要:Chlorophyll-a (Chl-a) concentration is an essential climate variable and fundamental to global carbon cycle studies and ocean environmental monitoring. HY-1C/1D satellites, equipped with the Chinese Coastal Ocean Color and Temperature Scanner (COCTS), enable global ocean color monitoring at kilometer-scale resolution. High-accuracy remote sensing algorithms for Chl-a concentration on the basis of COCTS data need to be developed to fully leverage these Chinese autonomous satellites for ocean monitoring and climate research.This study developed a Chl-a retrieval algorithm on the basis of a multilayer perceptron neural network (MLP-NN) for the COCTS sensor. The model inputs included remote sensing reflectance (Rrs) at COCTS center bands and environmental variables, such as geolocation, Sea Surface Temperature (SST), and Photosynthetically Active Radiation (PAR). The model was trained using 2,165 in-situ measurements collected from the global ocean. After a comparative analysis of mainstream machine learning models, MLP was selected as the core architecture for the NN framework. A multidimensional feature fusion strategy was implemented to construct the MLP-NN model. Given that multidimensional inputs could introduce redundancy, sensitivity analysis was conducted to quantify the contribution of each input, identify the optimal input set, and improve the model’s efficiency and generalization.The sensitivity analysis identified the following optimal combination for MLP-NN: Rrs at 412, 443, 490, 520, 565, and 670 nm; latitude; month; average SST from the previous month; and climatological PAR from the previous month. Validation indicated that Chl-a estimated by MLP-NN achieved a Root Mean Square Difference (RMSD) of 0.22 and a Median Absolute Percentage Difference (MAPD) of 29.1% for log-transformed Chl-a, which are 0.1 and 16.9% lower than those estimated by the NASA operational Ocean Color Index (OCI) algorithm, respectively. Further validation using satellite and in-situ matchups confirmed that MLP-NN outperformed OCI, reducing RMSD and MAPD by 0.09 and 9.8%, respectively, highlighting its improved robustness. In China’s Bohai Sea, both algorithms effectively captured the spatial distribution patterns of Chl-a. However, OCI exhibited systematic bias, underestimating Chl-a concentrations at high and low extremes. By contrast, the MLP-NN model demonstrated high accuracy in retrieving extreme Chl-a values.Overall, the MLP-NN model developed in this study substantially improves the estimation of Chl-a concentrations from HY-1C/1D satellite observations. It offers valuable algorithmic support for leveraging domestic satellites in ocean ecological monitoring.关键词:Chlorophyll-a (Chl-a);remote sensing reflectance;retrieval algorithm;HY-1C/1D satellites;neural network;COCTS;ocean color323|329|0更新时间:2026-02-09
Chinese Satellites
- “介绍了其在海冰监测领域的研究进展,相关专家提出了一种基于光谱形状特征的自适应分区方法,为解决渤海高动态悬浮泥沙海域中薄冰检测难度大的问题提供了有效解决方案。”
 摘要:Annual sea ice is an important indicator of climate change in mid-latitudes, especially the thin ice with a thickness of less than 10 cm has a more significant response to climate. The Bohai Sea, as a marine system with special research value in the temperate monsoon climate zone and even globally, shows a high degree of sensitivity in its natural ecological and socio-economic systems, and there is a significant bidirectional feedback effect between the sea ice dynamics and the regional climate and human activities. The Bohai Sea is affected by forty runoffs from the Yellow River, Liao River, and Hai River, and the concentration of Suspended Particulate Matter (SPM) in seawater is much higher than that in other sea areas, and the high dynamics of suspended sediment also leads to the complexity of the spectra of sea ice and seawater, which increases the difficulty of accurately detecting the extent of sea ice in the Bohai Sea.In this study, a segmented processing strategy was employed. Initially, sea ice with a thickness greater than 10 cm was extracted by means of a simple threshold segmentation method. Secondly, in order to address the challenges posed by the high spectral volatility of sea ice and the difficulty in detecting thin ice in the highly dynamic suspended sediment sea area of the Bohai Sea, this study proposes an adaptive partitioning method based on spectral shapes by deeply analysing the spectral characteristics of ice and water in this region. The method is predicated on the dynamic division of the Bohai Sea into regions characterised by low and high suspended particulate matter concentrations. Following this treatment, the spatial heterogeneity of SPM concentration in the region is significantly reduced, thereby effectively improving the detectability of thin ice with a thickness of less than 10 cm. Subsequently, an analysis was conducted on the four bands most commonly employed in optical images, with a view to ascertaining their degree of separability and identifying the preferred segmentation features. The analysis results demonstrate that the blue band and the near-infrared band are the most effective segmentation bands for low and high SPM concentration regions, respectively. The segmentation threshold is determined automatically based on the preferred features using the single-peak threshold method, and the image edge features are fused to enhance the robustness of the algorithm.The present method is applied to five optical images, MODIS, Sentinel-2, GF-1, Sentinel-3 and GOCI, and the accuracy is verified by using the 12 views of sea ice interpretation maps and sample points of high-resolution remote sensing images for the years 2017—2019 released by the North Sea Forecasting Centre of the Ministry of Natural Resources. The results show that the accuracy of this algorithm can reach more than 90% and is applicable to a variety of optical images; simulation experiments using the spectral linearity mixing model demonstrate that this algorithm is capable of identifying annual sea ice with densities of more than 30% in highly dynamic suspended sediment sea areas.This method can automatically, stably, efficiently and accurately extract annual sea ice, which can be applied to multi-source sensors, and also provides data support for researching climate change by giving full play to the advantages of multi-source remote sensing data for more comprehensive and fine sea ice monitoring.关键词:Bohai sea;annual sea ice;multiple optical sensors;suspended particulate matter concentration;concave convex index;adaptive marine zoning;single-peak threshold method;automatic detection algorithm123|167|0更新时间:2026-02-09
 - “南极海岸线研究取得新进展,专家提出双边界融合算法,有效改善冰崖海岸线提取精度,为预测海平面变化提供有力支持。”
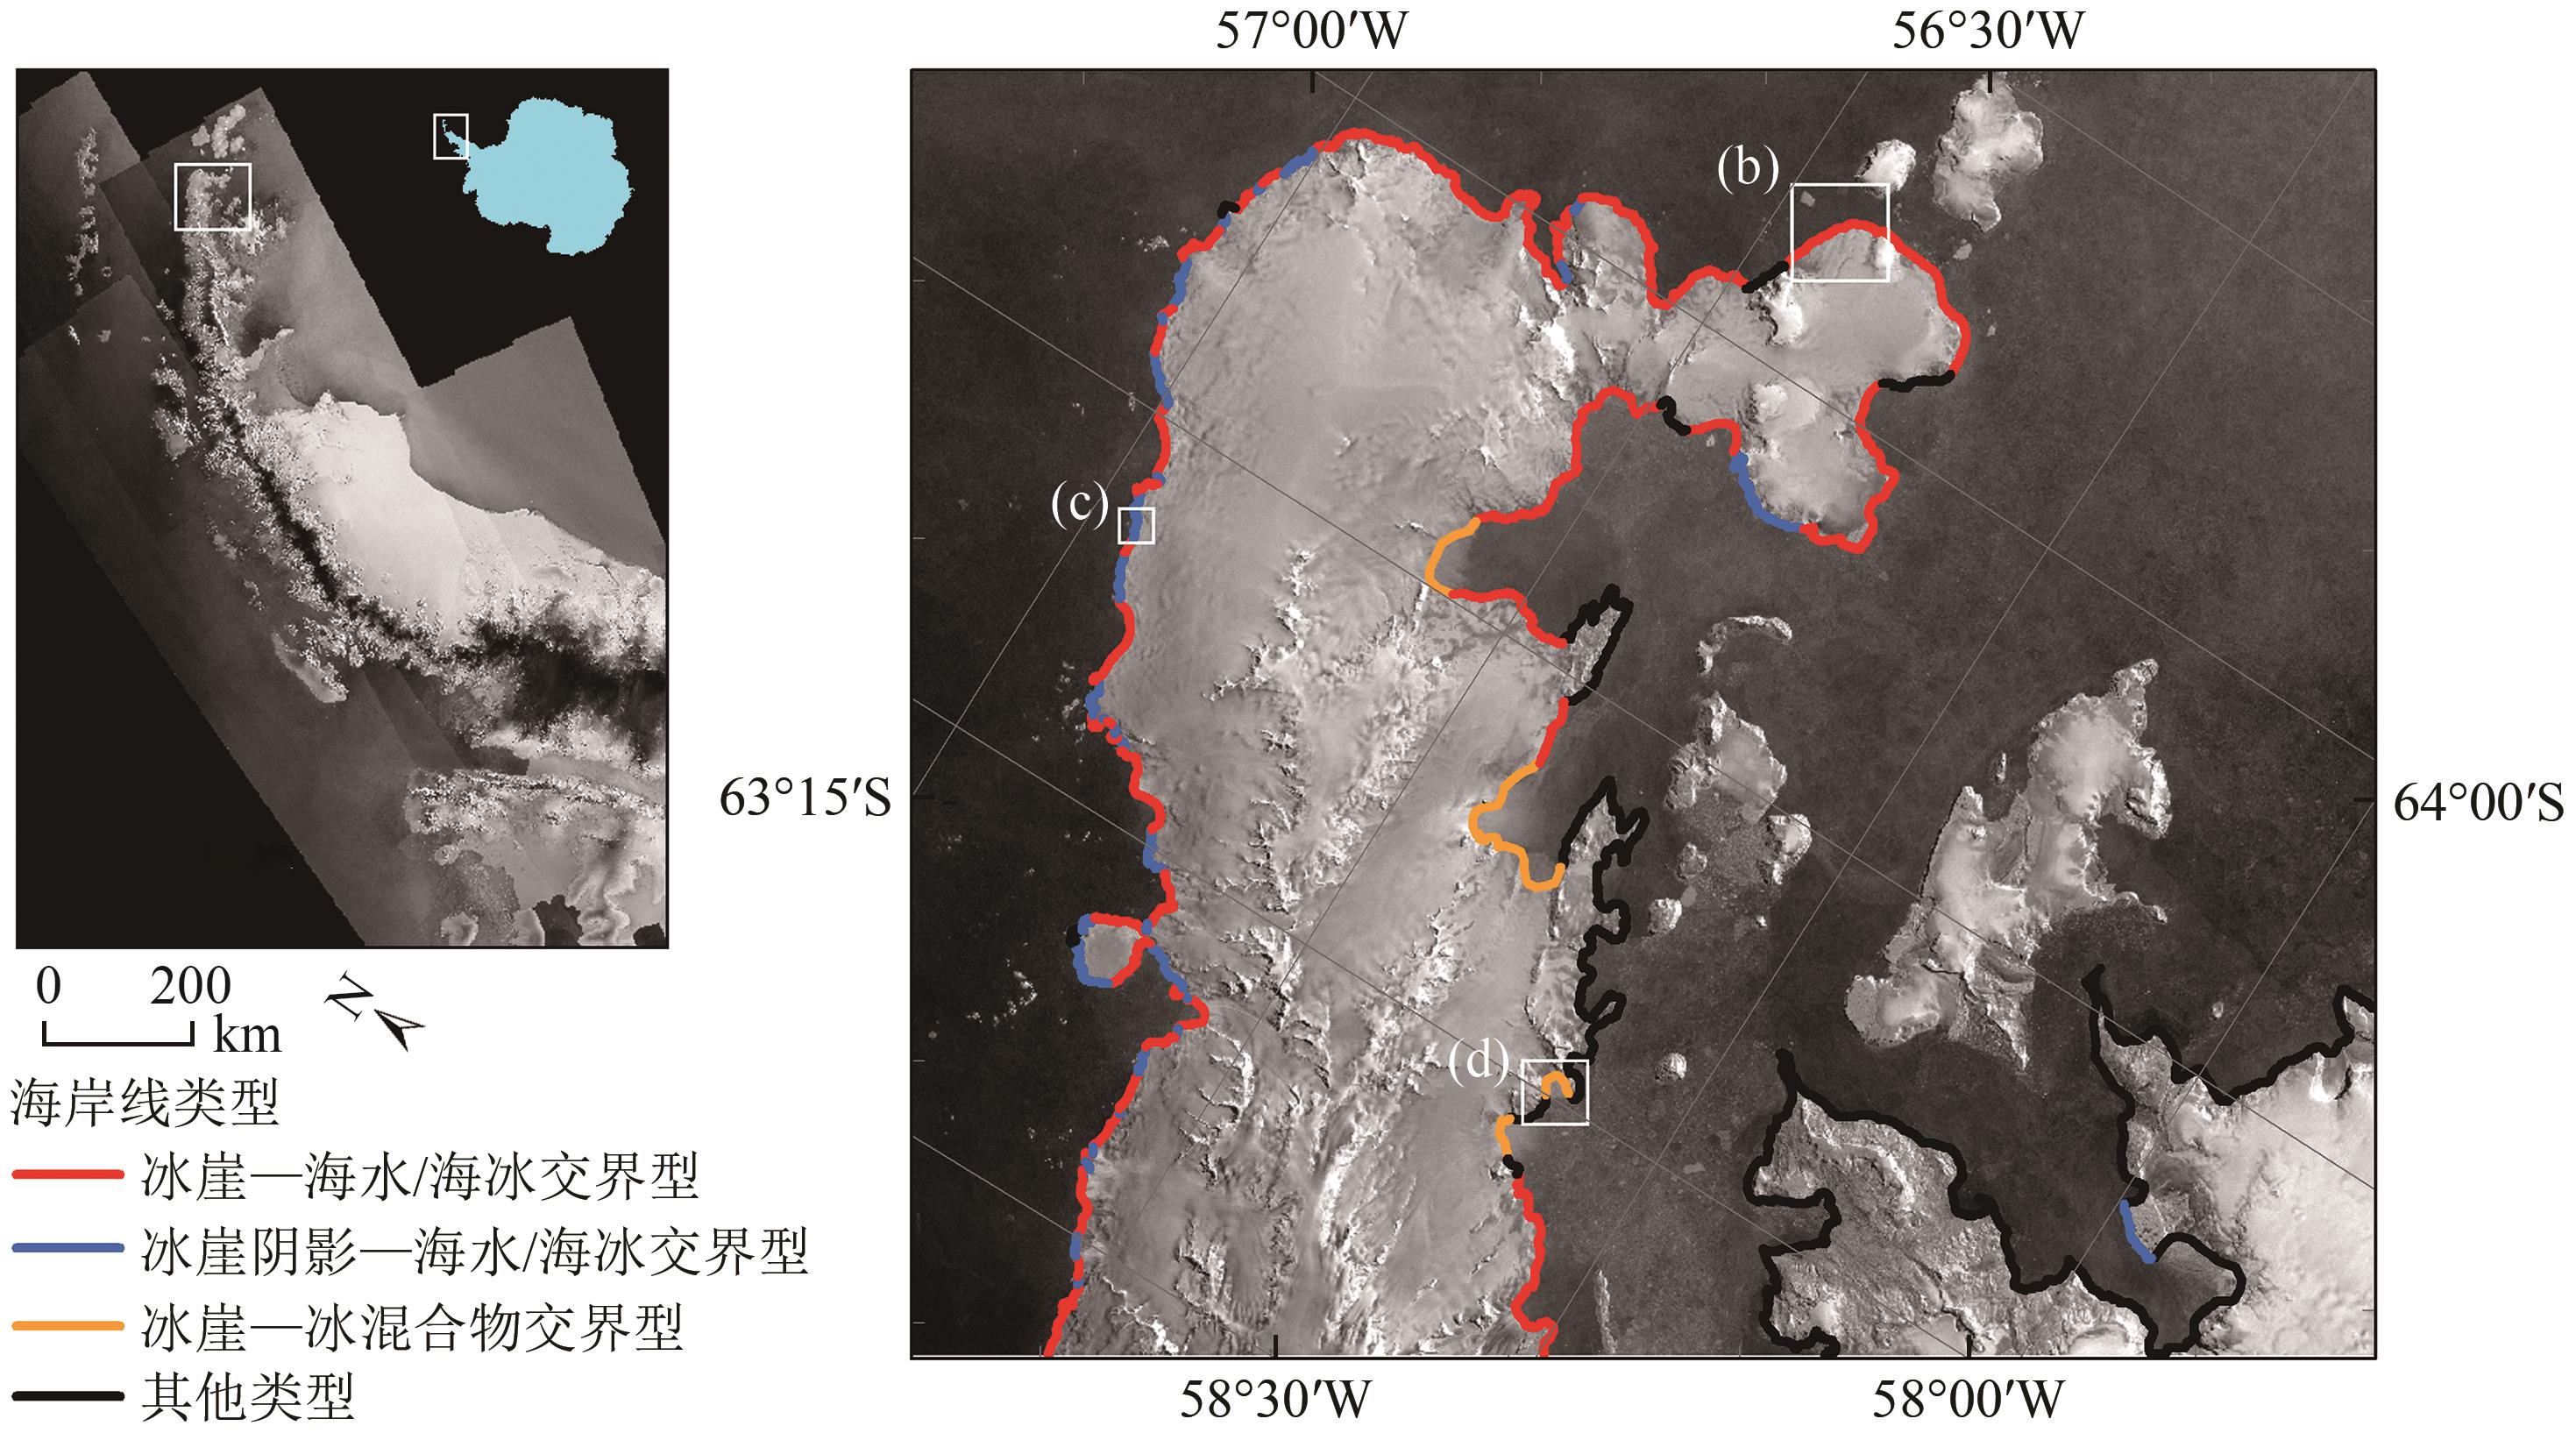 摘要:The Antarctic coastline is highly sensitive to global environmental change and is undergoing rapid transformation because of global warming. The retreat of ice shelves has led to increased direct exposure of glaciers to the ocean, forming iceclifftype coastlines that terminate at grounded glaciers. These coastlines are key zones for studying ice sheet instability, and accurate monitoring of their changes is crucial for predicting future sea level rise. However, compared with iceshelf-type coastlines, ice cliff coastlines, with their complex and subtle variations, present considerable challenges, and high-precision extraction algorithms still require further development. This study proposes a dual-boundary fusion algorithm on the basis of the topological closure relationship between threshold- and edge-derived boundaries, enabling the high-precision extraction of continuous coastlines. An automatic error self-assessment method on the basis of different boundary connectivity features is introduced. With typical regions on the Antarctic Peninsula as examples, Sentinel-1 SAR data with 15 m resolution are used to extract ice cliff coastlines. The performance of the dual-boundary fusion algorithm is validated through full-sample assessment across three types of ice cliff coastline interfaces, namely, ice cliff-seawater (sea ice), ice cliff shadow-seawater (sea ice), and ice cliff-mélange. Results show that the proposed algorithm can accurately and automatically extract the first two types of ice cliff coastlines, which account for 92% of the total ice cliff coastline length in the study area. For the ice cliff-sea water (sea ice) interface, the mean error is 0.31 ± 1.13 pixels (at 15 m resolution), with 85.8% of the coastline having zero-pixel error. For the ice cliff shadow-seawater (sea ice) interface, the mean error is 0.56 ± 1.55 pixels, and 74.9% of the coastline has zero-pixel error. By contrast, for the ice cliff-mélange interface, 83.8% of the coastline has an error exceeding 20 pixels in an unsupervised setting; however, the algorithm can automatically identify these large low-accuracy regions for subsequent refinement. The dual-boundary fusion algorithm effectively addresses the accuracy limitations of threshold segmentation and the noise sensitivity of edge detection without requiring training samples. It is computationally efficient and suitable for long-term, high-precision monitoring of most ice cliff coastlines across Antarctica.关键词:Antarctic icecliff coastline;automatic coastline extraction;dual-boundary fusion algorithm;threshold segmentation;edge detection;Sentinel-1 SAR GRD data262|238|0更新时间:2026-02-09
 - “中国成功发射陆地探测一号卫星,为冰缘地貌形变监测提供高时空分辨率数据源,专家利用该卫星数据,通过Stacking-InSAR、时序InSAR方法提取石冰川、岩屑坡高分辨率形变,为冰缘地貌形变监测开辟新方向。”
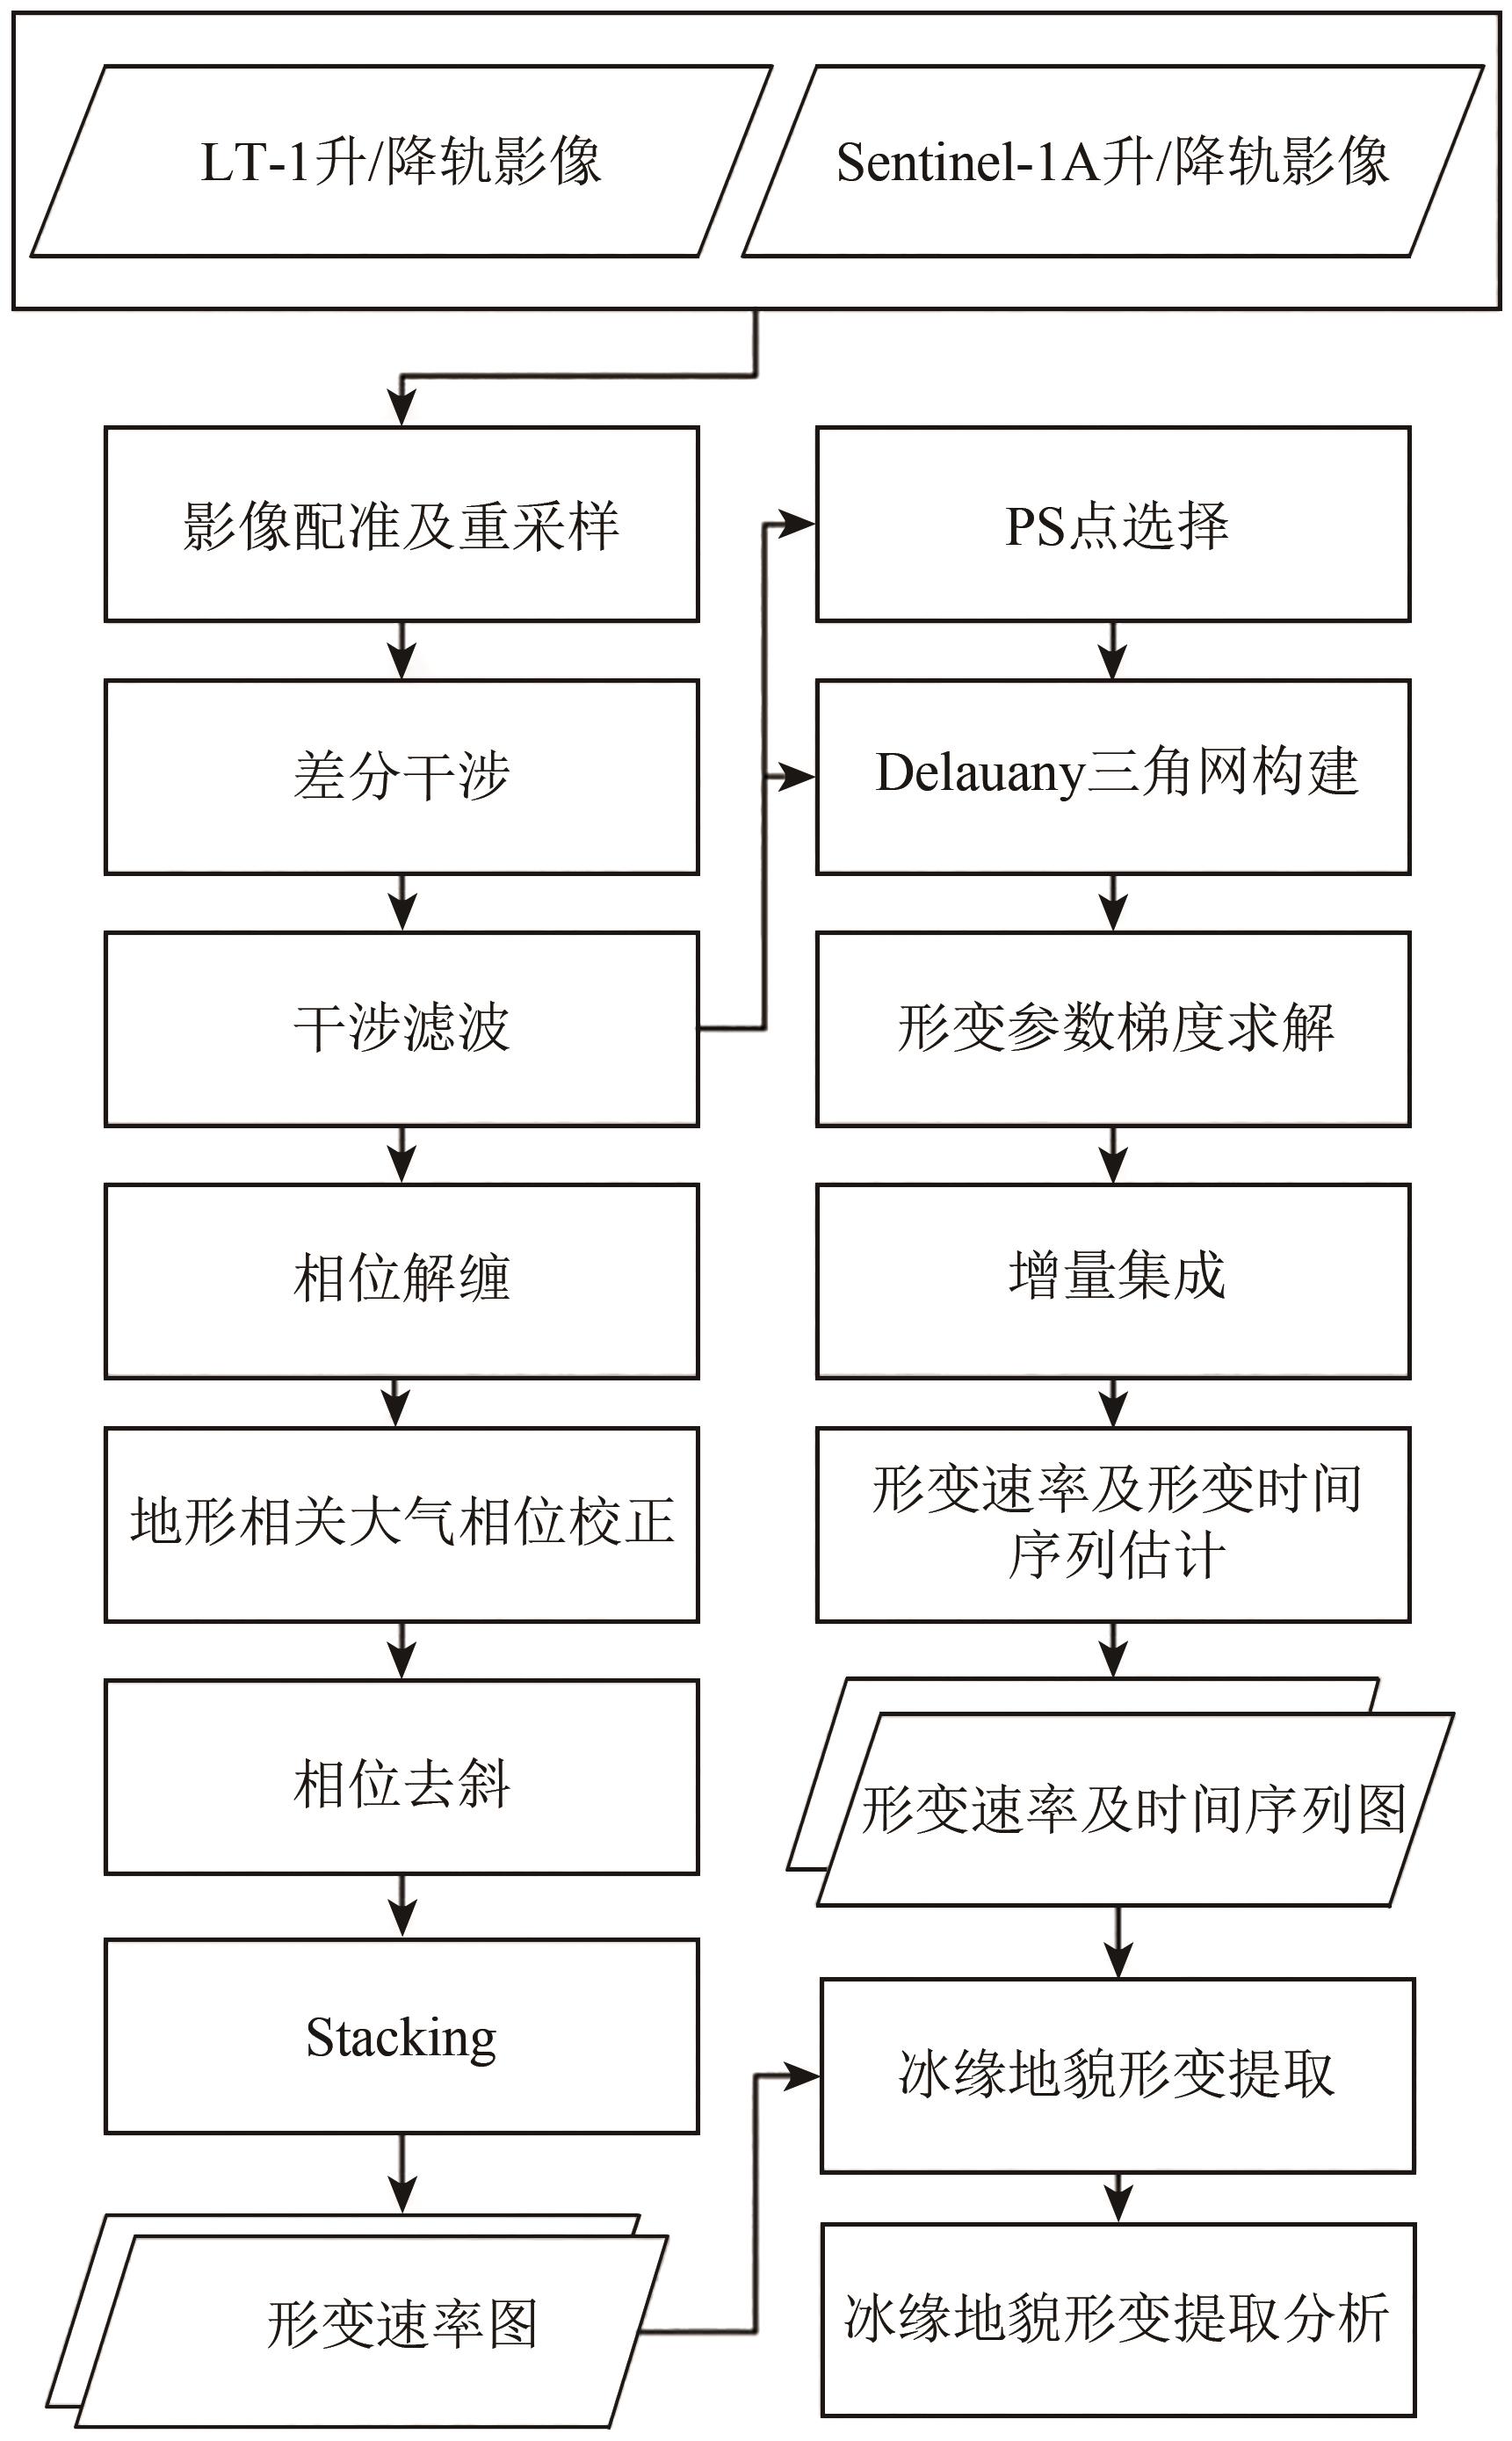 摘要:Periglacial landforms are distinctive surface features shaped by frost weathering and freeze-thaw cycles, and they are commonly found in the permafrost regions of the cold periglacial zones on the Tibetan Plateau. Changes in these landforms serve as key indicators of climate change on the plateau and are substantial contributors to geological hazards, such as permafrost landslides, in periglacial environments. Rock glacier and talus are typical types of periglacial landforms. Studying the spatiotemporal deformation characteristics of periglacial landforms is crucial for understanding the physical mechanisms and dynamic processes of their deformation, identifying potential geological hazard risks, and enhancing the ability to prevent secondary disasters. In early 2022, China successfully launched a high-resolution L-band differential interferometric SAR (LT-1) satellite constellation, with surface deformation monitoring as its core mission. This satellite is a new source of data with high spatiotemporal resolution for research on periglacial landform deformation. This study focused on deformation detection of two typical periglacial landforms (rock glaciers and talus) developed in the Nyainqêntanglha mountains on the Tibetan Plateau and used newly acquired ascending and descending LT-1 SAR data. An inventory of rock glaciers and talus was compiled using high-resolution optical imagery from Gaofen-2 (GF-2) and Gaofen-7 (GF-7) satellites, and 1,094 rock glaciers and 148 talus slopes were identified. A total of 15 ascending and 10 descending scenes of 3-meter-resolution Stripmap1-mode data from the LT-1 SAR satellite constellation, acquired between July 2023 and August 2024, were used for the analysis. Surface deformation across the study area was detected using stacking-InSAR and multitemporal InSAR (MT-InSAR) methods. Then, the actively moving areas within the identified rock glaciers and talus were delineated on the basis of the stacking InSAR and MT-InSAR deformation results. Comparative deformation analysis using Sentinel-1A data from the same period as LT-1 was conducted to validate the deformation results acquired by LT-1 SAR. The deformation interpretation results acquired by LT-1 from stacking-InSAR show that 83% of the rock glaciers in the study area are active, and 80.8% of the taluses exhibit active regions. The MT-InSAR results indicate that 77.8% of the rock glaciers are active, and 72% of the taluses contain active regions. The active regions extracted by stacking-InSAR and MT-InSAR show fine consistency. The annual cumulative deformation of rock glaciers within the study area ranges from 0.06 m to 0.16 m, and that of taluses ranges from 0.01 m to 0.09 m, indicating that taluses are less active than rock glaciers. The temporal movement of both landforms exhibits heterogeneity characterized primarily by seasonal variation, with high movement rates in summer and stability in winter. The research findings indicate that the deformation results obtained from LT-1 are consistent with those derived from Sentinel-1A data, demonstrating the accuracy of the LT-1 satellite results. The LT-1 satellite demonstrates fine application capabilities in complex periglacial environments, effectively extracting the spatiotemporal deformation of rock glaciers and taluses. Stacking InSAR can effectively, accurately, and quickly identify active areas of rock glaciers and taluses, allowing for the assessment of their activity. The MT-InSAR method can provide accurate quantitative analysis of the deformation time series for rock glaciers and taluses.关键词:Rock glacier;Talus;LT-1;MT-InSAR;deformation monitoring;Tibetan Plateau219|592|0更新时间:2026-02-09
Remote Sensing of Cryosphere
- “介绍了其在梯田研究领域的进展,专家提出基于变化检测算法的长时序梯田提取方法,为获取梯田时空变化数据提供新方案。”
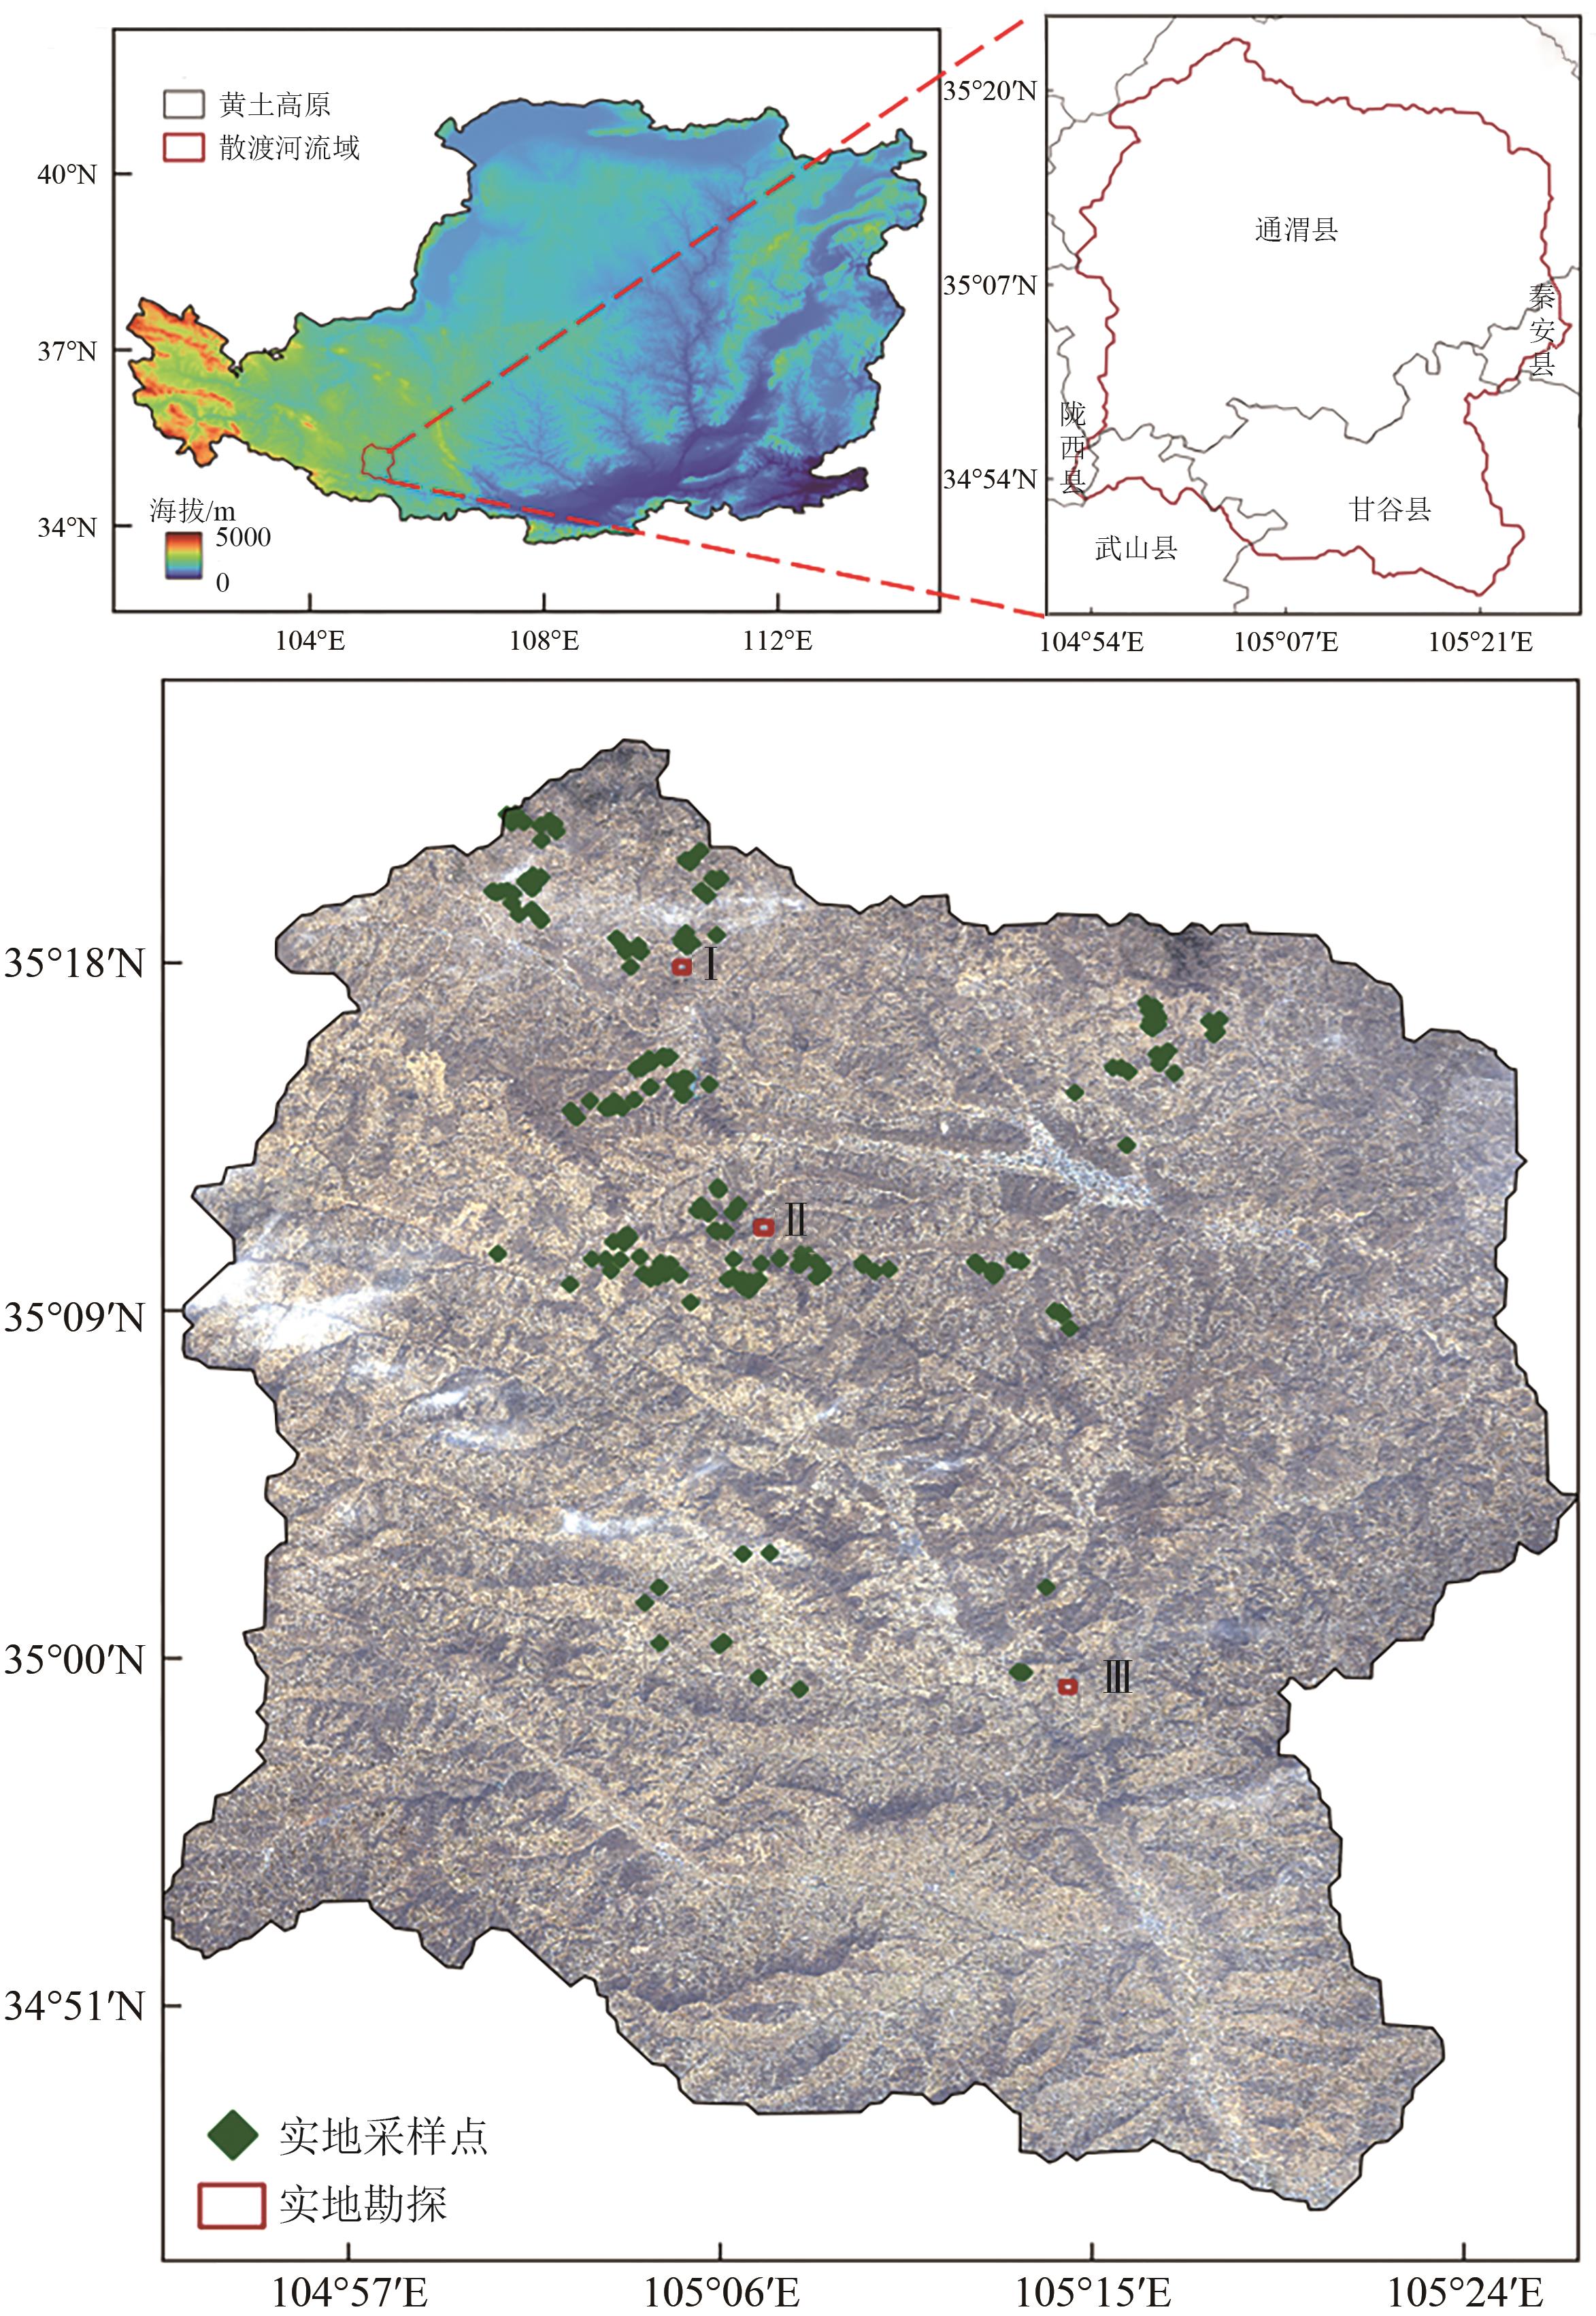 摘要:Terraces, as an important agricultural landscape, play a crucial role in enhancing crop yield, conserving soil and water, and reducing erosion. Spatiotemporal data on terrace changes serve as a vital foundation for assessing their eco-hydrological effects. This study developed a long-term terrace extraction method on the basis of the Landsat-based Detection of Trends in Disturbance and Recovery (LandTrendr) algorithm. By integrating panchromatic bands with long-term Landsat satellite imagery, the method enhanced the accuracy of terrace evolution analysis. To ensure consistency and minimize sensor-induced distortions, this study normalized data from Landsat 7 ETM+ and Landsat 8 OLI, yielding a reliable dataset for detecting spatiotemporal changes in terraced fields. Moreover, multiple images captured in each year were composited to reduce cloud interference, generating an annual cloud-free scene optimized for LandTrendr change detection. LandTrendr regards interannual variations as noise and focuses on tracking persistent changes over multiple years. It effectively smooths spectral noise in long-duration signals while capturing sudden spectral shifts, making it well-suited for terrace construction detection. Pixel-based analysis enables multiscale change detection, identifying localized and large-scale transformations. The data-driven algorithm supports flexible time-series segmentation, fitting linear segments, facilitating segmentation, reducing noise, and identifying annual terrace variations in Sandu River Basin. The output raster map includes attributes, such as the year of terrace establishment, duration, and magnitude of change. On the basis of the 2020 terrace distribution map, this study retrieved the spatiotemporal distribution of terraces from 2001 to 2020 in Sandu River Basin, a tributary of Wei River. Statistical methods were employed to examine the interrelationships among terrace area, evapotranspiration, and grain yield, clarifying broad environmental implications. The findings revealed that the Landsat time-series data integrated with panchromatic bands achieved a change detection accuracy of 82.50% with an F1-score of 0.84. By 2020, the total terraced field area in Sandu River Basin had expanded to 1274 km2, marking a 45.27% increase from 2001. Additional 397 km2 of newly formed terraces were established in the hilly and mountainous areas surrounding Sandu River Basin, and the central region remained dominated by villages, towns, and flatlands characterized by plains arable land. Growth rates peaked before 2015, followed by a gradual decline, but the overall trend continued to exhibit steady expansion. Influenced by agricultural advancements, climate conditions, water management, and vegetation distribution, terrace area and evapotranspiration exhibited asynchronous variation, indicating relative ecosystem stability amid land-use changes. Notably, terrace area showed a strong correlation with grain yield (R²=0.94) because of population growth, policy support, agricultural technology, ecological principles, and other factors. This research demonstrated the efficacy of integrating Landsat long-term satellite imagery with panchromatic bands into the LandTrendr change detection algorithm to systematically reveal the temporal and spatial evolution of terrace areas. By effectively identifying change characteristics, the study contributes valuable insights into ecological monitoring, land-use change analysis, and sustainable agricultural practices. The ability to dynamically assess terrace expansion provides essential data support for policy-making, environmental conservation, and strategic land management initiatives.关键词:terraced field mapping;time series extraction;Landsat;change detection;LandTrendr105|92|0更新时间:2026-02-09
 - “日光诱导叶绿素荧光SIF是植被光合作用时发射的微弱光学信号,近年来被广泛应用于植被生产力估算、胁迫监测和物候监测等多个领域。本研究基于山地森林站点塔基观测获取的高光谱数据,对6种SIF反演算法展开了对比分析与评价,阐明了这些算法间的差异,为今后不同使用情境下SIF反演算法的选择提供了参考。”
 摘要:Solar-induced chlorophyll fluorescence (SIF), a weak optical signal emitted by vegetation during photosynthesis under natural sunlight, serves as a nondestructive probe for vegetation photosynthesis and has been widely applied to estimate productivity, monitor stress, and track phenology. While tower-based near-surface SIF observations provide a fine-scale understanding of vegetation physiology, direct SIF measurement remains challenging because of SIF’s weak signal and interference from reflected light. Although various spectra-based SIF retrieval algorithms exist, the differences in their performance and adaptability under varying conditions are poorly understood. This study compared and evaluated six SIF retrieval algorithms by using tower-based hyperspectral data. With high-resolution hyperspectral data acquired from tower-based observations at a mountainous forest site, six SIF retrieval algorithms, namely, sFLD, 3FLD, iFLD, SFM, SVD, and BSF, were systematically applied and compared. Algorithm performance was assessed using the retrieved SIF signals and their relationships with key vegetation indicators (near-infrared radiance of vegetation or NIRvR and gross primary production or GPP). (1) The traditional FLD algorithms (sFLD, 3FLD, and iFLD) yielded highly consistent results (R2 > 0.86). SVD’s retrievals were much higher than the retrievals of the other algorithms, and SFM and BSF maintained strong correlations with all other algorithms. (2) SFM, SVD, and BSF demonstrated superior accuracy and stability compared with the traditional FLD algorithms (ΔR2 of 0.29 for NIRvR and 0.10 for GPP). SFM’s retrievals consistently maintained a high correlation with GPP even in cloudy or unstable weather, making SFM highly suitable for complex environments. SVD-retrieved SIF effectively captured diurnal variations in vegetation response to solar radiation changes. (3) The BSF algorithm showed high sensitivity to observation height and prior weight settings but low sensitivity to temperature parameters. Optimal BSF application thus requires parameter adjustment on the basis of specific scenarios and data characteristics. This study clarified the differences among six representative SIF retrieval algorithms. SFM is recommended for complex environments, such as cloudy conditions, and SVD excels in tracking diurnal radiation-driven variations. Meanwhile, BSF requires careful parameterization. These results can provide critical guidance for selecting appropriate SIF retrieval algorithms on the basis of specific research objectives and environmental conditions.关键词:solar-induced chlorophyll fluorescence (SIF);Retrieval Algorithm Evaluation;Tower-Based Observations;hyperspectral data;Gross Primary Production (GPP);Mountain forest189|252|0更新时间:2026-02-09
 - “中国东北地区森林冠层高度估测研究取得新进展,专家提出RF - EBK模型,基于多源遥感数据,有效提高估测精度,为精准营林管理提供技术支持。”
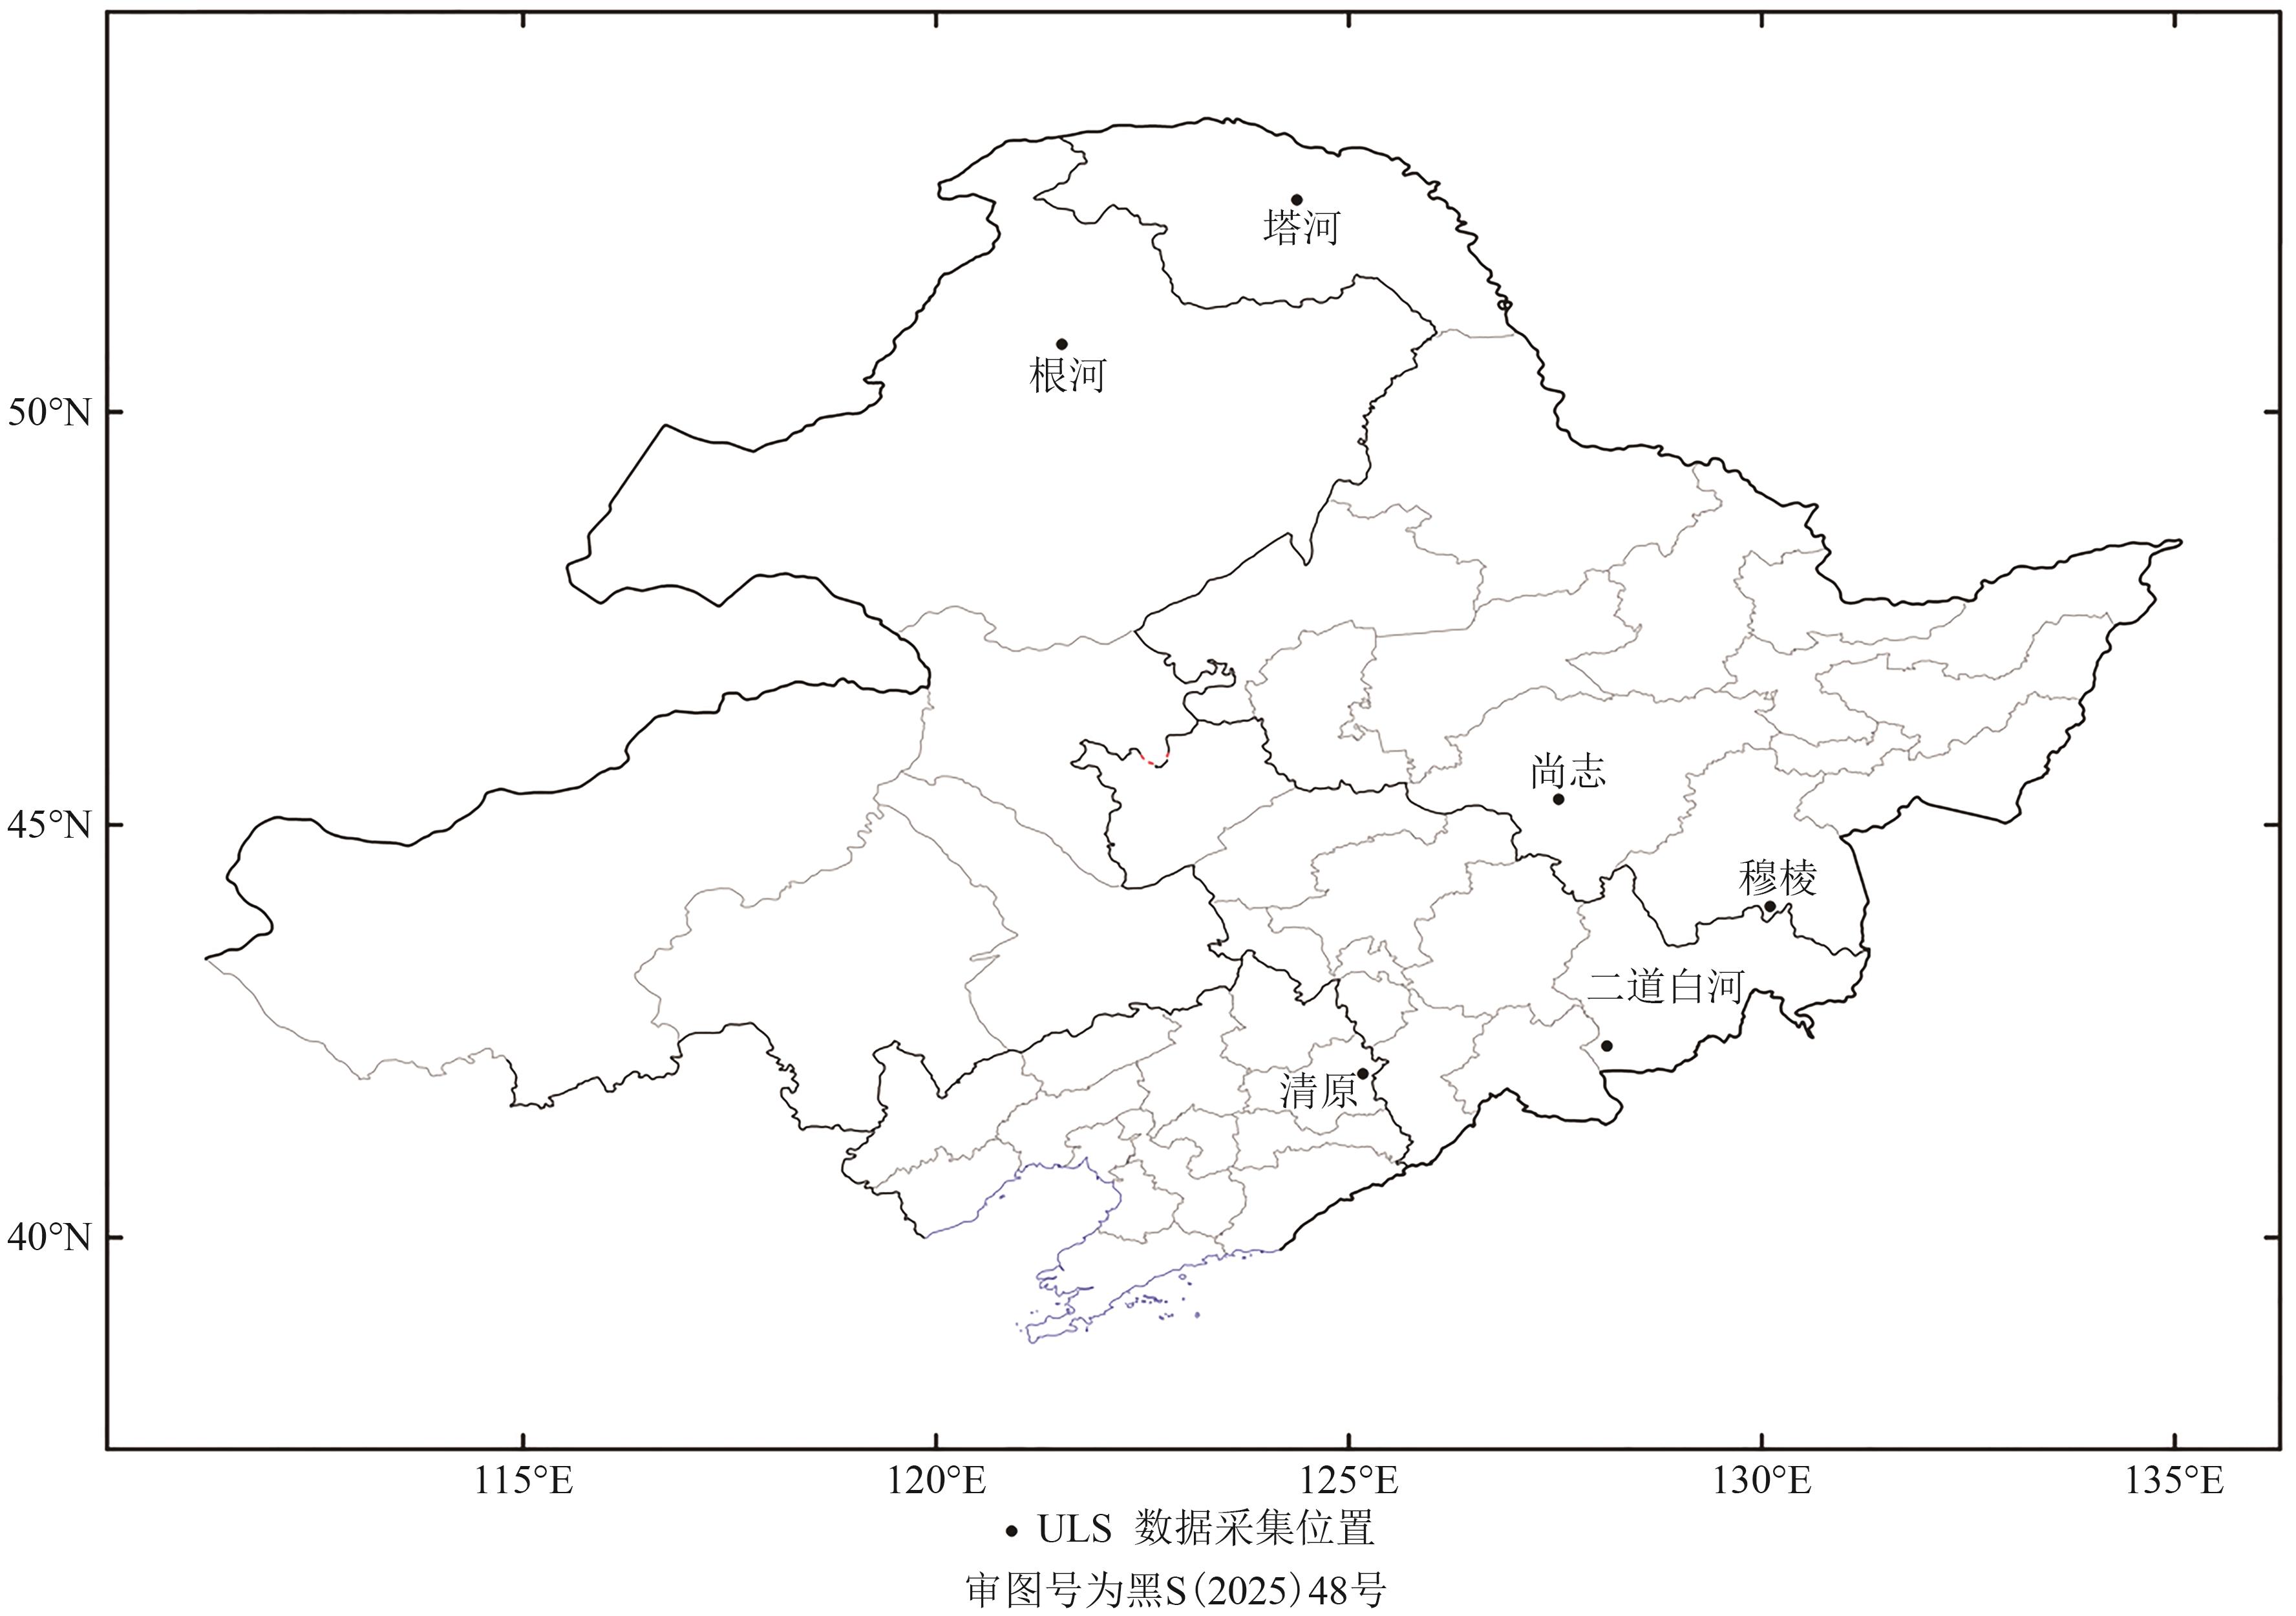 摘要:Forest canopy height, a key parameter that reflects the vertical structure of forests, is essential for understanding the structure and function of forest ecosystems. Accurate estimation of canopy height is important for carbon cycle assessments, above-ground biomass estimation, and ecosystem health monitoring. With the continuous advancement of remote sensing technologies, particularly the integration of LiDAR and optical remote sensing data, the potential for estimating forest canopy height at regional scales has become increasingly prominent, making it a current research hotspot in forest resource monitoring. This study focuses on Northeast China (NEC) and proposes a hybrid model that integrates Random Forest (RF) and Empirical Bayesian Kriging (EBK), referred to as the RF-EBK model, to enhance the accuracy and robustness of regional-scale canopy height estimation. The model incorporates discrete canopy height data from spaceborne LiDAR ICESat-2 (ATL08), Landsat 8 OLI imagery, Shuttle Radar Topography Mission elevation data, and forest canopy cover data. Initially, a recursive feature elimination method with cross validation is employed to select optimal variables, reduce redundancy, and improve the model’s generalization ability. The RF model is then used to produce initial canopy height estimates, and residuals are calculated using a test dataset. Given the spatial autocorrelation of the residuals, the EBK method is applied to spatially model and interpolate them, generating a continuous residual surface across the study area. This residual surface is used to correct the RF predictions, effectively improving estimation accuracy. Ultimately, a highly accurate forest canopy height map at 30 m resolution for NEC in 2023 is produced. Results show that forest canopy cover is the most important variable in the model. Among the topographic factors, slope, elevation, and aspect are highly influential, reflecting the remarkable role of terrain in vegetation type and growth conditions. In terms of optical remote sensing features, the original Landsat 8 OLI bands, namely, B2, B4, and B7, exhibit high importance. Moreover, texture features derived from bands B3, B6, and B7 (i.e., B3_savg, B6_savg, and B7_savg) are more important than those from the original bands, underscoring the value of incorporating spatial texture features into canopy height estimation. Tasseled cap greenness, indicative of canopy cover and vegetation health, also shows strong predictive power. In terms of model performance, the RF-EBK model considerably outperforms the standalone RF model by effectively mitigating the overestimation of low canopy heights and underestimation of high canopy heights. After residual correction, the coefficient of determination (R²) on the validation set increases by 59.52%, and the root mean square error (RMSE) and relative root mean square error (rRMSE) decrease by 27%. Furthermore, canopy height measurements extracted from unmanned aerial vehicle laser scanning data collected from six sites are used as reference data for model validation. Results show that the RF-EBK model achieves high accuracy, with an R² of 0.69, RMSE of 1.65 m, and rRMSE of 7.81%. In conclusion, the RF-EBK model is a reliable approach for highly accurate estimation of forest canopy height at the regional scale and offers robust technical support for precision silviculture and sustainable forest resource management in NEC.关键词:ICESat-2;unmanned aerial vehicle laser scanning;Landsat 8 OLI;random forests;empirical Bayesian kriging310|1082|0更新时间:2026-02-09
Forestry and Agriculture
- “介绍了其在时空融合领域的研究进展,专家比较了4种时空融合模型对地表温度的融合效果,为精细化遥感数据生产提供了新思路。”
 摘要:Spatiotemporal fusion is the most effective method to combine the two attributes of high spatial resolution and high temporal resolution and is essential for producing refined remote sensing data products. However, most spatiotemporal fusion models are based on surface reflectance data and the normalized difference vegetation index and rarely applied to Land Surface Temperature (LST) data. In addition, existing evaluations of spatiotemporal fusion models of LST do not fully consider the effects of different data combinations and data correlations on model performance.This study selects four spatiotemporal fusion modelsESTARFM, STRUM, FSDAF, and EDCSTFN. A long-term LST dataset is constructed based on Landsat 8-9 and MODIS data. The fusion accuracy of the four models is verified and analyzed using ground-truth data and actual Landsat LST imagery. Comparative experiments are conducted under different surface environments, data combinations at different spatial scales, and data correlations.Results show that (1) among the models, EDCSTFN has the highest LST fusion accuracy, followed by FSDAF and ESTARFM; STRUM has the lowest accuracy. The fusion image of ESTARFM and EDCSTFN has a good visual effect, and the fusion image of STRUM and FSDAF model is smooth. (2) The fusion effect of the four models is excellent in the single area of the ground object structure, followed by the area with obvious phenological changes. The fusion effect is poor in the area with a complex land cover type. EDCSTFN maintains high accuracy even in different surface environments, especially in areas with complex surface cover types, but it is inferior to ESTARFM in areas with a simple surface structure. (3) With the increase in the spatial scale difference, the fusion accuracies of ESTARFM, STRUM, and FSDAF models exhibit a regular decline, whereas the fusion accuracy of EDCSTFN does not decrease. (4) With the reduction in data correlation, the fusion accuracies of the four models show a regular decline, but among the models, EDCSTFN demonstrates good stability and robustness.Overall, the complexity of the surface cover type substantially affects the accuracy of the spatiotemporal fusion models. Among the four models, ESTARFM and EDCSTFN have the highest fusion accuracy, but EDCSTFN has better stability and robustness than ESTARFM. The results of this study can provide an important reference for subsequent research on application model selection and fusion model optimization.关键词:spatiotemporal fusion;LST;ESTARFM;STRUM;FSDAF;EDCSTFN231|338|0更新时间:2026-02-09
 - “遥感地表温度产品是城市热环境演变研究的重要数据源。然而,受遥感器回访周期长及云雨天气情况下数据缺失等因素影响,高分辨率地表温度产品的代表性不足,导致精细尺度下城市长时序热环境的研究受限。本研究利用Landsat和MODIS遥感数据,采用时空融合方法重建了2013年—2022年武汉市核心城区夏季长时序高分辨率地表温度均值,并在精细尺度对武汉市热环境演变进行了分析。结果表明:(1)重建的高分辨率地表温度均值产品与地面站点观测数据具有较强的一致性,同时可以反映精细尺度下城市热环境时空变化的高度异质性;(2)2013年—2022年,武汉市主城区高地表温度区占比呈现降低趋势并沿新城组群向周边区域扩张,原本独立的高温区域逐渐连接成片;(3)2013年—2022年,武汉市各新城组群夏季高地表温度区除东南新城组群外皆呈现出扩张趋势,其中北部、西部、西南部扩张明显。本研究可为精细尺度下城市热环境的时空格局研究提供支撑,对城市生态文明建设和可持续发展具有重要意义。”
 摘要:Remote sensing-derived Land Surface Temperature (LST) products are essential for studying urban thermal environment dynamics. However, limitations, such as long revisit intervals of remote sensors and data gaps caused by cloudy or rainy weather, hinder the representativeness of high-resolution LST products. As a result, long-term studies on urban thermal environments at fine spatial scales remain constrained. This study aims to reconstruct high-resolution summer mean LST data for Wuhan’s core urban area from 2013 to 2022 by using Landsat and MODIS remote sensing data through spatiotemporal fusion methods and to analyze the evolution of Wuhan’s thermal environment at a fine scale. The research employed spatiotemporal fusion techniques to integrate Landsat and MODIS data and reconstruct long-term high-resolution summer mean LST for Wuhan’s core urban area. The study area covered Wuhan’s central city and urban development zones. Validation was conducted using ground meteorological station data, and accuracy was assessed through Mean Absolute Error (MAE), Root Mean Squared Error (RMSE), and R² metrics. LST classification and trend analysis were performed to examine the spatiotemporal patterns of thermal environment changes.Result (1) The reconstructed high-resolution mean LST product demonstrated strong consistency with ground observations (MAE=0.478 ℃, RMSE=0.5965 ℃, R²=0.8538), effectively capturing the high spatiotemporal heterogeneity of urban thermal environments at fine scales. (2) From 2013 to 2022, the proportion of high-temperature zones in Wuhan’s main urban area decreased while expanding toward surrounding new town clusters along the development axes, with previously isolated high-temperature areas gradually merging. (3) During 2013—2022, all new town clusters, except the southeastern cluster, exhibited expanded high-temperature zones, with notable growth in northern, western, and southwestern areas.Conclusion This study provides an effective approach for reconstructing high-resolution LST data and analyzing fine-scale urban thermal environment patterns. The findings offer valuable insights into urban ecological civilization construction and sustainable development, supporting evidence-based urban planning and heat island mitigation strategies. The methodology and results help advance research on the spatiotemporal patterns of urban thermal environments at fine scales.关键词:urban thermal environment;mean land surface temperature;land surface temperature reconstruction;multi-source spatiotemporal fusion;Spatiotemporal evolution;Mann-Kendall trend test;spatiotemporal resolution;Wuhan City300|445|0更新时间:2026-02-09
City and Land
- “深度学习在遥感影像建筑物提取领域取得进展,专家提出形状与位置先验信息引导的域适应提取方法,有效提升不同环境下建筑物信息识别能力,为解决域间数据分布差异问题提供新方案。”
 摘要:Deep learning is an effective approach for building extraction from remote sensing images. However, when the distributions of training (source domain) and test (target domain) data differ, the accuracy of a model trained only in the source domain substantially decreases when the model is applied directly in the target domain. The domain adaptation method can overcome differences in data distribution between domains, thereby improving the recognition of building information in different environments. It increases the efficiency of urban planning, post disaster reconstruction, and land use management. However, the difficulty and cost of obtaining target domain labels in building domain adaptation extraction are high.Current methods do not fully utilize the invariant properties of buildings to provide cross-domain consistency constraints. This study proposes a domain-adaptive building extraction method from remote sensing imagery guided by shape and position prior information. The approach has several main components. First, building corners in the target domain are automatically extracted through the comprehensive application of methods, such as the building index and Harris operator, and the edges of labeled buildings in the source domain are obtained using image morphological processing. These extracted features serve as shape priors for both domains. Second, a Gaussian transformation-based method is designed to convert the OSM objects in the target domain and the labeled objects in the source domain to position prior information in the dual domain. Finally, a shape loss is constructed using the aforementioned shape prior information, and training constraints are provided for buildings in both domains. The dual-domain position prior information is used as independent additional channels to superimpose image layers to form a four-channel input, enriching the building information in the target domain. A building domain adaptation extraction model called AU_adaptNet is also designed based on adversarial learning.Experimental results show that the intersection over union metrics of the proposed method can be improved by 15% compared with that of the base generative model without domain adaptation and by 6% compared with that of the domain-adaptation model without added prior information guidance. When the target domain has no OSM data, domain adaptation accuracy can be improved by relying only on shape prior information guidance. Under conditions with low OSM data integrity in the target domain, comparable results can be achieved with semi-supervised domain adaptation methods by using high-quality target-domain labels.The following conclusions are derived. (1) The proposed method extracts invariant features (e.g., corners and edges) from source and target domain buildings as shape prior while simultaneously incorporating crowdsourced data from the target domain as position prior, resulting in a building extraction framework guided by shape and position prior for domain adaptation. (2) When OSM data in the target domain exhibit low completeness, the proposed method’s performance is comparable to that of semi-supervised domain adaptation approaches that utilize high-quality target-domain labels.关键词:building extraction;domain adaptation;remote sensing imagery;prior information;OSM162|280|0更新时间:2026-02-09
 - “湖泊水体颜色是湖泊生态系统的重要气候变量,近年来,基于卫星遥感反演湖泊水色的Forel-Ule指数(FUI)被广泛用于指示大区域湖泊生态与水质的时空变化。多源卫星协同观测可显著提升观测频率和时空覆盖范围,但其反演一致性问题亟需解决。本研究以青藏高原6个典型湖泊为研究区,基于Landsat 5/TM、Landsat 7/ETM+、Landsat 8/OLI和MODIS地表反射率产品,提出一种多源卫星数据反演湖泊水色指数FUI的一致性校正方法,以校正卫星光谱响应函数及地表反射率产品系统偏差导致的色度角和FUI反演差异。”
 摘要:The color of lake water, as a direct reflection of its optical properties, is an important climate variable of lake ecosystems. In recent years, the Forel–Ule Index (FUI) derived from satellite remote sensing has been widely used to indicate spatiotemporal variations in lake ecology and water quality over large areas. Multisource satellite observations can substantially improve observation frequency and spatiotemporal coverage; however, the consistency of FUI retrieval across different satellites remains a challenge. This study focuses on six typical lakes on the Tibetan Plateau and develops a consistency correction method for FUI retrieval by using multisource satellite data, including Landsat 5/TM, Landsat 7/ETM+, Landsat 8/OLI, and MODIS surface reflectance products. The method aims to correct the retrieval differences in hue angles and FUI caused by variations in satellite spectral response functions and systematic biases in surface reflectance products. First, a polynomial correction approach is applied to a water body simulation dataset to perform spectral response correction for hue angles derived from the visible bands of different satellite sensors. Second, a linear regression model is established between MODIS and Landsat TM, ETM+, and OLI retrievals of hue angles for cross correction by using 112830 pairs of surface reflectance synchronous observations from the six lakes. Finally, the consistency of multisource satellite data is systematically evaluated at the pixel scale and the time series scale on the basis of the synchronous observations and long-term FUI retrievals.Result Results show that the consistency of the derived hue angles and FUI substantially improves after correction (R2>0.95, MAPE<10%), and the annual mean FUI trends derived from the four satellite datasets are consistent. This study provides an important methodological reference for the synergistic retrieval of lake water color parameters by using Landsat TM, ETM+, OLI, and MODIS multisource satellite data.关键词:Water color;multi-source satellite remote sensing;Spectral response function;Consistency correction;hue angle;FUI (Forel-Ule Index);water reflectance;lakes on the Qinghai-Tibet Plateau314|420|0更新时间:2026-02-09
 -
Intelligent computation of geospatial object parameters guided by spatial distribution patterns AI导读
“介绍了其在土地空间参数计算领域的研究进展,相关专家构建了耦合空间模式的地理目标对象认知与参数计算框架,为地表空间数字化表达及参数计算提供了一种有效框架,并为该框架在不同地表区域的应用方式提供科学依据。” 摘要:As a natural composite entity integrating geomorphology, climate, hydrology, soil, and vegetation, land sustains human habitation and productive activities. The status monitoring of various target objects—specifically, the accurate calculation of surface parameters—serves as a fundamental basis for informed decision-making in the context of transitions toward high-quality development. Current approaches mostly rely on purely data-driven intelligent models to calculate parameters at the pixel scale and tend to overlook inherent spatiotemporal relationships among objects, features, and parameters. This situation may lead to limitations, such as imprecise parameter-bearing units and lack of mechanistic information. To address these obstacles, this study proposes an intelligent framework for spatial object cognition and parameter computation, with focus on spatial patterns formed by object–parameter groups.The framework is structured into three phasesspatial deconstruction and object feature reconstruction, multiscale spatial pattern construction, and parameter calculation with uncertainty analysis. First, continuous spatial domains are decomposed into hierarchical object-level representations by using multisource remote sensing data. Second, multiscale spatial patterns, which are defined as correlations among object-parameter groups, are formalized across three dimensions: vertical (interactions between objects and their parent entities), horizontal (correlations among peer objects), and internal (attribute relationships within objects). These patterns provide geoscientific constraints (e.g., value domain limitation and homogeneity correction) and contextual information (e.g., neighborhood features) to guide parameter computation. Finally, spatial patterns are synergistically coupled with intelligent algorithms (e.g., machine learning models) to optimize feature spaces and solution domains.Experimental validation in areas within hilly, plain, and mountainous areas demonstrates that multiscale patterns effectively constrain feature and solution spaces, thereby reducing computational uncertainty substantially. Vertical patterns enforce legitimate value ranges for object parameters to correct misclassified units. Horizontal patterns leverage object morphology to impose homogeneity constraints, thus reducing feature ambiguity. Lateral patterns integrate spectral, spatial, and environmental similarities to enhance classification accuracy, particularly in small-sample scenarios.This study establishes a unified paradigm for object-level spatial cognition and parameter computation in remote sensing. Spatial patterns serve as digital abstractions of geoscientific mechanisms, bridging discrete object representations and dynamic land surface processes, thereby enabling a systematic reduction of uncertainty. Practically, the framework offers an efficacious methodology for object-level parameter computation by integrating spatial patterns with intelligent algorithms. It may be applied across diverse terrestrial systems for qualitative/quantitative parameters through spatial analysis of target regions. Theoretically, the spatial patterns can be regarded as a highly condensed representation of the distribution and evolution mechanism of land space, re-linking discrete digital land objects and guiding the orderly diffusion of multisource information in the relevant structure. The patterns express the current state of cognition and indicate the direction for future cognition. Future work should focus on adaptive pattern systems and automated uncertainty propagation models to address the complexity of Earth’s surface systems.关键词:land space parameter calculation;vegetation classification;crop classification;remote sensing geoscience analysis;spatial pattern;Object-Based;deep learning51|263|0更新时间:2026-02-09
 -
Error traceability in remote sensing product production and validation: Methods and applications AI导读
“遥感产品是地球资源监测的重要数据来源,随着产品生产与服务体系不断完善,推进高质量遥感产品发展迫在眉睫。遥感产品质量问题是多源误差综合影响的结果,虽然可以通过真实性检验计算其整体精度,但无法详细反映各环节误差的具体来源及大小。为保证遥感产品的可靠性,地球质量保障框架(QA4EO)特别强调了遥感产品误差溯源,旨在将遥感产品的误差追溯到统一的参考基准或国际标准。本文聚焦于遥感产品生产与检验中的误差溯源,参考量值溯源方法,分析了测量与遥感产品的误差来源,阐述了真实性检验与误差溯源的基本内涵,总结了遥感产品生产与检验中误差溯源的基本方法及其典型应用,并对误差溯源的未来发展趋势进行展望。结果表明,当前误差溯源的基本方法主要涵盖3大类:基于不确定度溯源方法、误差分解及反演方法,以及算法测评和真实性检验综合方法。这些方法典型服务于真实性检验参考真值和遥感基础辐射产品的误差溯源中。未来,发展全链路误差传递模型并建立可溯源的质量标识是突破溯源瓶颈的关键。本研究可为进一步实现遥感产品生产与真实性检验提供理论和技术支持。介绍了其在遥感产品生产与检验领域的研究进展,专家们聚焦于误差溯源,建立了量值溯源体系,为解决遥感产品质量问题提供解决方案。” 摘要:Remote sensing products are crucial for Earth resource monitoring, environmental governance, and climate change research. With the continuous enhancement of the product production and service system, high-quality remote sensing products need to be developed. The quality of remote sensing products is inherently influenced by multisource errors originating from sensor performance limitations, radiometric calibration, atmospheric correction, geometric distortions, and retrieval uncertainties. The errors introduced at each stage are cumulatively propagated, leading to substantial uncertainty in the quality of the derived remote sensing products. Although the validation method offers quantitative assessment, it cannot reflect the specific sources and magnitudes of errors in detail. The guidance documents provided by the Quality Assurance Framework for Earth Observation particularly emphasize that data and derived products must be associated with an indicator of quality that is traceable to reference standards (preferably the International System of Units [SI]) to ensure the reliability and consistency of these products. This traceability framework enables quantitative interproduct comparisons and objectively characterizes accuracy disparities.This study focuses on error traceability in remote sensing product production and validation. Errors originate from two distinct sources: intrinsic product errors and measurement uncertainties associated with ground reference data. The study commences with a detailed description of the origins of these errors in both components. Subsequently, it elucidates the fundamental concepts of validation and error traceability, highlighting the importance of establishing SI-traceable propagation chains. Three main methods of error traceability in remote sensing product production and validation, namely, uncertainty estimation, error decomposition, and combining algorithm test and validation, are also summarized. The core objective is to accurately determine the sources and magnitudes of errors at each stage of product production and validation. Typical applications of these methods are illustrated through case studies, which provide a foundation for analyzing error propagation mechanisms and developing error propagation models. The conclusions and prospects for the future development of error traceability are also summarized.Understanding the law of error propagation and establishing a comprehensive error transmission chain are crucial issues to be addressed in error traceability research. They are vital for algorithm improvement and product quality enhancement. Currently, the study on error traceability in remote sensing products remains at its infancy, with few existing investigations in this area. Moreover, developing traceable quality indicator systems that fully reflect uncertainties arising from input data, processing, and validation procedures is an essential component of error traceability. These indicators serve as a vital means of presenting traceability results. Producers and users are concerned about the quality of remote sensing products. The findings of this study provide theoretical and technological support for the further advancement of remote sensing product production and validation. However, how to further address the key issues of error traceability in the future, particularly in terms of constructing a whole-process error propagation model and developing a traceability method that considers accuracy and uncertainty, remains a critical area that requires in-depth investigation.关键词:remote sensing product;Error;Uncertainty;validation;error traceability220|533|0更新时间:2026-02-09
 - “介绍了其在遥感大数据领域的研究进展,相关专家提出了一种融合二维与三维网格划分的高效时空索引与查询优化方法,为解决遥感影像分析的性能瓶颈问题提供了有效解决方案。”
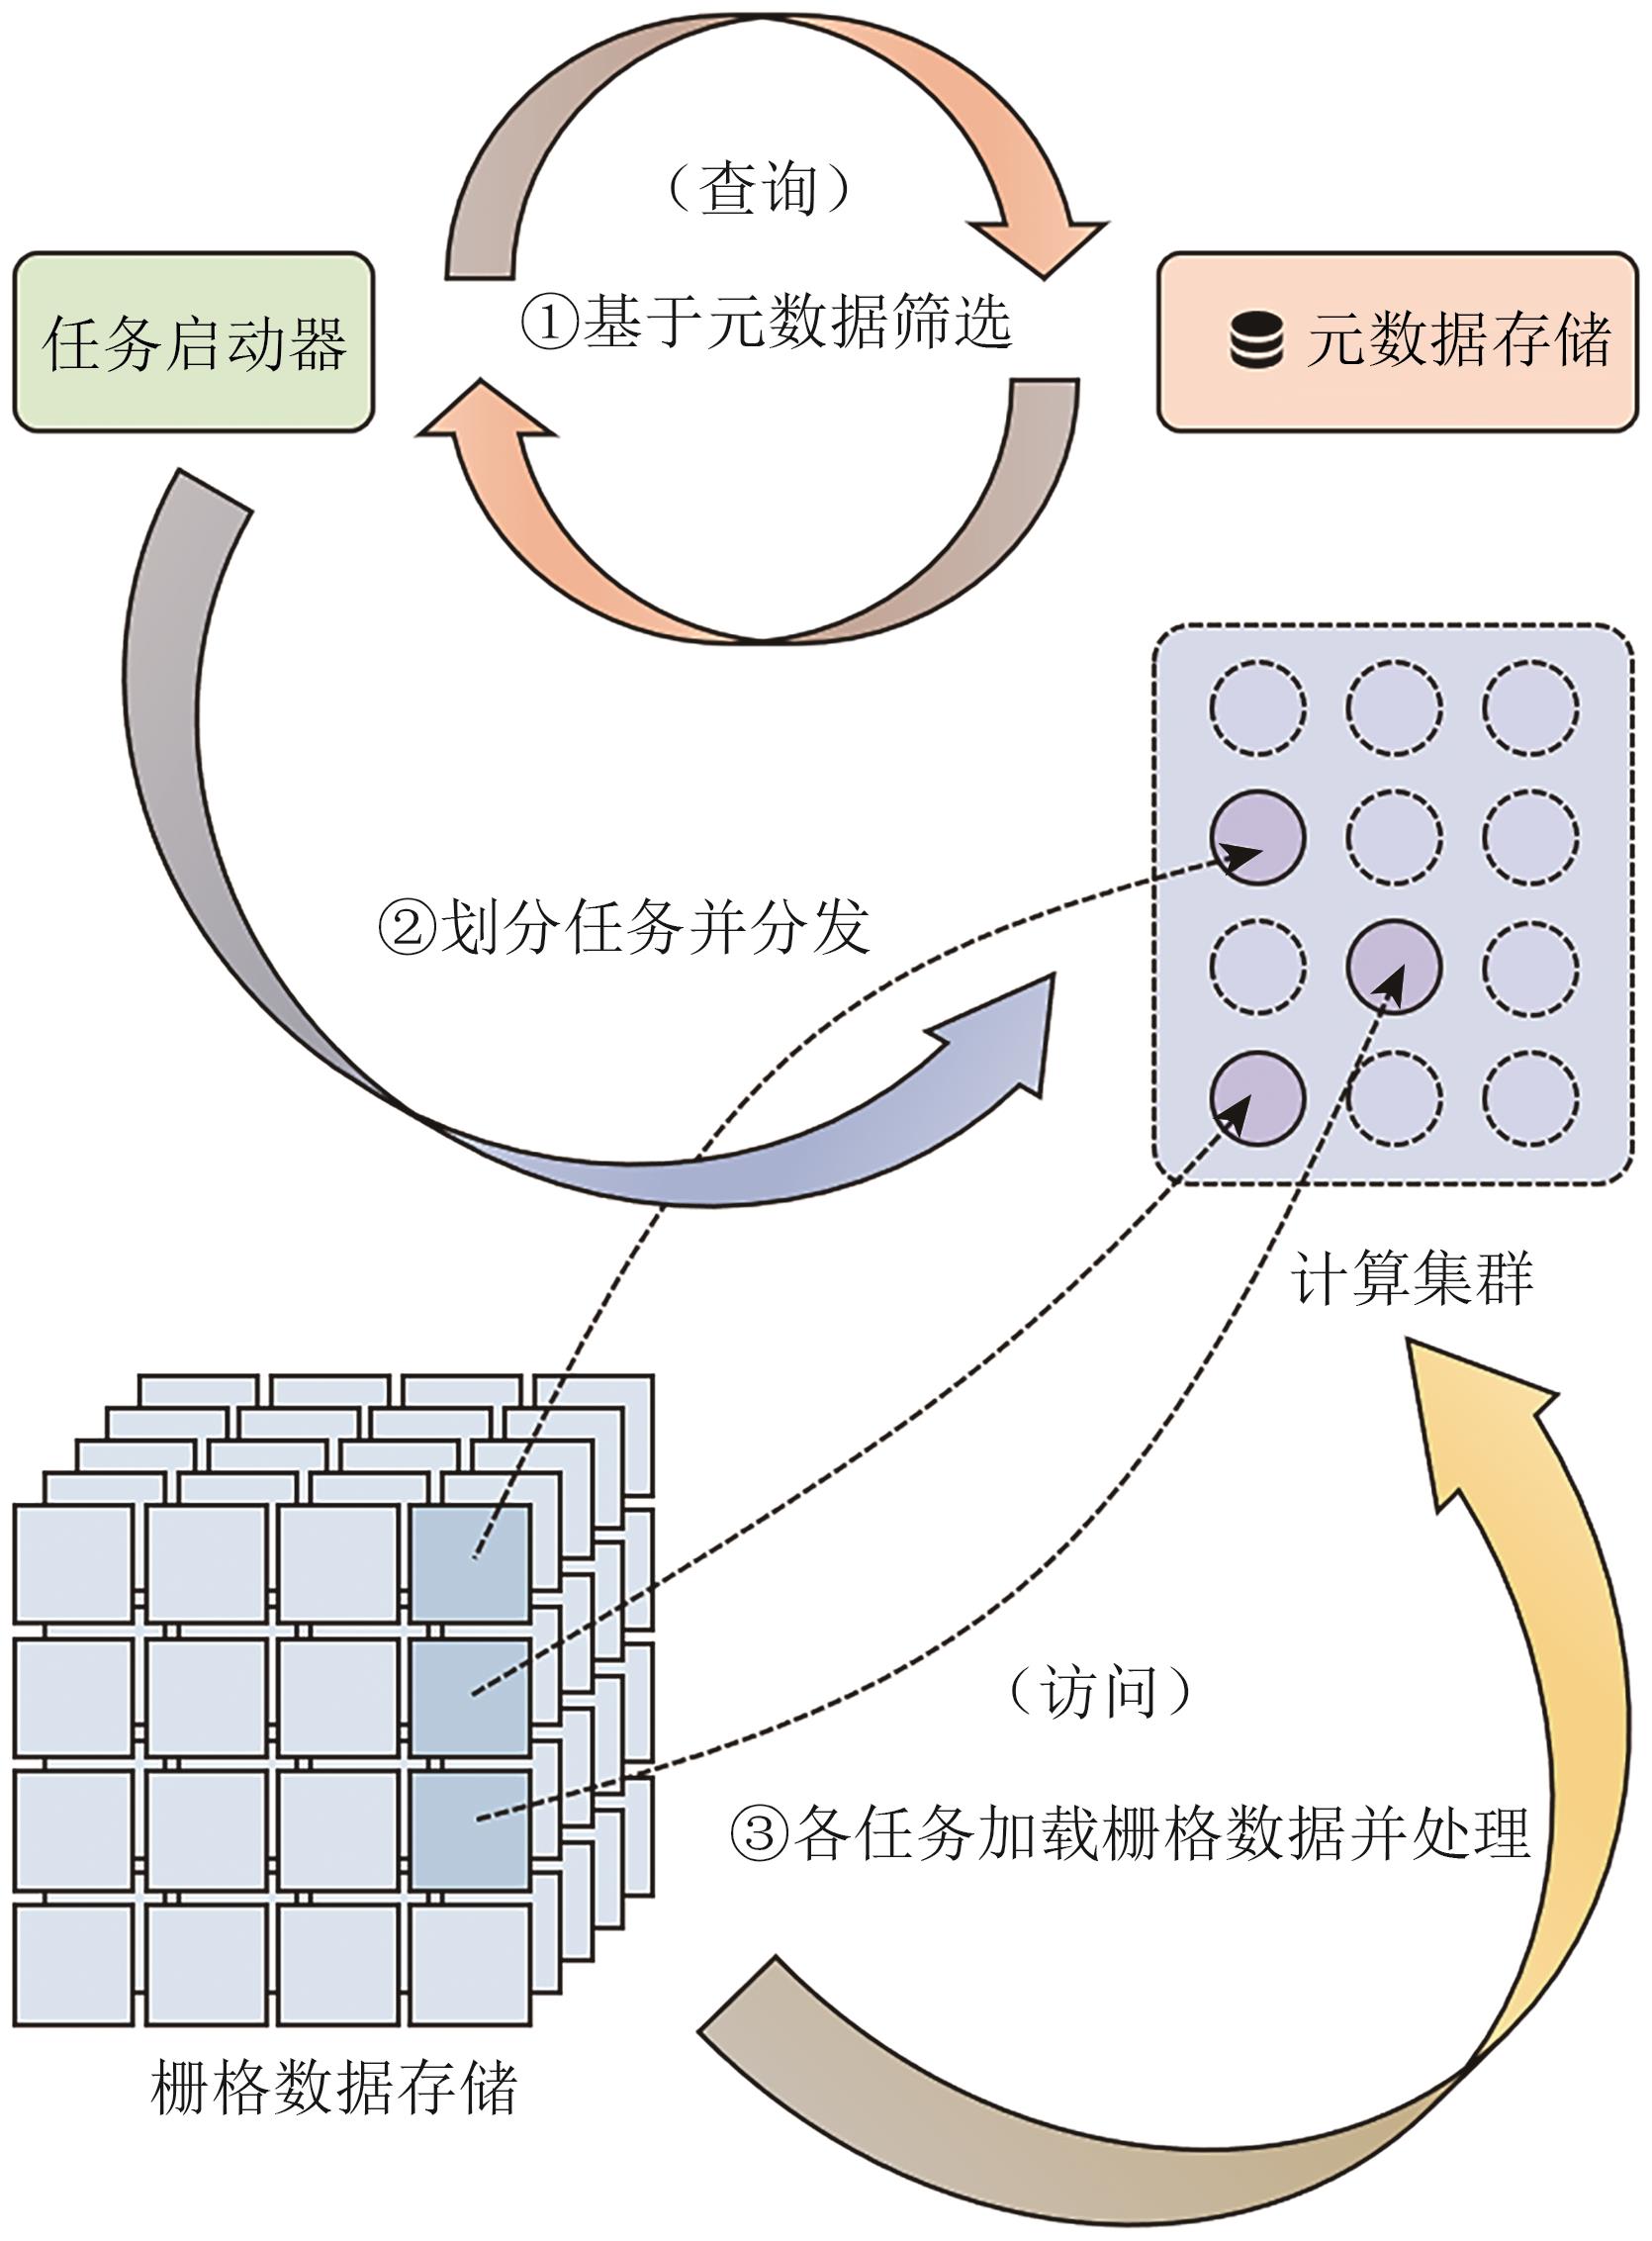 摘要:With the rapid development of large-scale remote sensing data acquisition technologies, an enormous volume of Earth observation data are generated every day. Online remote sensing analysis platforms, such as Google Earth Engine and Sentinel Hub, have significantly lowered the barrier to conducting large-scale environmental and geospatial studies. Consequently, remote sensing data have been widely applied in agricultural and grain yield monitoring, land-use planning, environmental change detection, forest coverage assessment, and oceanographic research. These applications have provided essential technical support for sustainable development, climate monitoring, and natural resource management. However, as the scale, resolution, and update frequency of remote sensing metadata continue to grow, conventional database systems are increasingly unable to meet the timeliness and responsiveness required for interactive online analysis. A typical spatiotemporal range query over million-level or even billion-level metadata records may take tens of seconds to execute, which severely limits user experience, disrupts data analysis workflows, and limits real-time visualization capabilities. Large-scale and complex range queries have thus become a critical performance bottleneck in current remote sensing analysis systems.To address these challenges, we propose an efficient spatiotemporal query optimization method based on the fusion of two-dimensional (2D) and three-dimensional (3D) grid indexing. The proposed method first performs spatial range matching by employing an adaptive 2D grid partitioning strategy that divides the spatial domain into high-precision grid cells. According to the temporal constraints in the query, selected 2D cells are dynamically converted into 3D grid units, forming a hybrid 2D-3D hierarchical index. This design allows the query to focus on a significantly smaller subset of the data space, thereby reducing computational complexity while maintaining accuracy. Once the hierarchical grid structure has been constructed, an efficient encoding scheme is required to enable fast indexing and range searches across the entire spatiotemporal domain. All grid units are therefore encoded using Z-order space-filling curves, which map multidimensional coordinates into one-dimensional integer values. As a result, spatiotemporal queries can be efficiently transformed into range queries over these encoded keys, which are naturally supported by most NoSQL and spatial databases. Furthermore, a query partitioning and scheduling mechanism is developed based on the spatiotemporal locality of grid cells. This mechanism supports parallel and distributed query execution, enabling the method to scale efficiently with increasing data volumes and computing capacity.We implemented the proposed method on both MongoDB and PostGIS platforms to evaluate its generality and performance. Experimental results demonstrate that the optimized index structure and query partitioning mechanism significantly reduce query time—by up to 93.11% on MongoDB and 88.02% on PostGIS—compared with their native indexing approaches. The proposed method effectively improves system responsiveness, enabling near-real-time spatiotemporal query processing even on million-scale datasets.In summary, this work provides a practical and high-performance solution for accelerating spatiotemporal queries in large-scale remote sensing analysis systems. The method is lightweight, easy to integrate into existing database frameworks, and adaptable to distributed and cloud-based environments. It provides not only technical insights into optimizing spatiotemporal database performance but also a reference framework for future applications involving intelligent remote sensing data management, multi-source data fusion, and dynamic environmental monitoring.关键词:remote sensing big data;remote sensing imagery;spatiotemporal query;spatiotemporal grid partitioning;indexing optimization;spatiotemporal locality;remote sensing cloud computing platform;spatiotemporal database162|743|0更新时间:2026-02-09
 - “介绍了其在极化分解领域的研究进展,相关专家重新解释了极化取向角补偿POAC,将其视为不同散射机制间的功率迁移过程,通过酉矩阵旋转恢复散射信号的反射对称状态,并构建五分量分解模型,为提升复杂场景下的散射机制识别能力提供解决方案。”
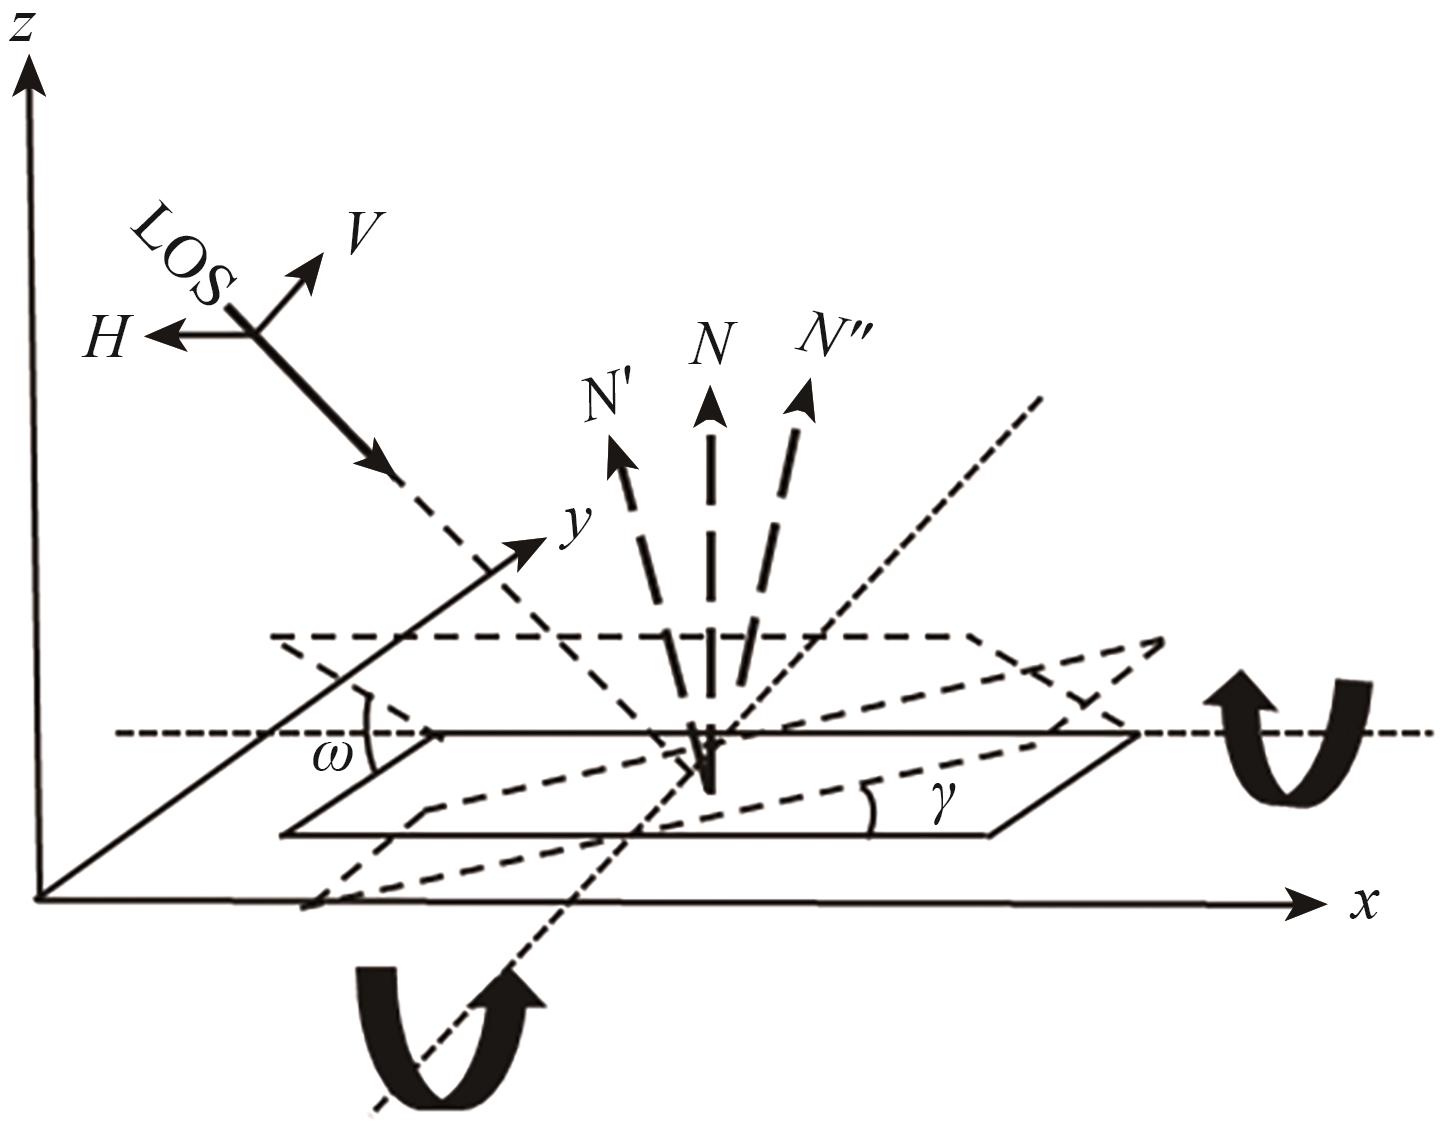 摘要:Model-based polarimetric decomposition methods are widely used in polarimetric Synthetic Aperture Radar (SAR) data analysis because of their simplicity and clear physical interpretation. However, their performance is often compromised by depolarization effects in complex scattering environments. Polarimetric Orientation Angle Compensation (POAC) is employed to mitigate depolarization effects by restoring reflection symmetry and thus improving the general applicability and accuracy of decomposition results. However, POAC relies on geometrical correction, exhibits limited effectiveness in complex scenes, and lacks a comprehensive explanation for how scattering power is redistributed among different mechanisms. This work addresses these shortcomings by reinterpreting POAC through the concept of power transfer, on the basis of which a five-component decomposition framework is constructed.This study reinterprets POAC as a power transfer process in which scattering power is redistributed among channels via unitary matrix rotation. A unitary transformation framework that restores the measured coherency matrix to an ideal reflection-symmetric form is established. Within this framework, we propose the power transfer five-component scattering decomposition (PT5SD) method, which (1) estimates two polarization orientation angles from the coherency matrix, (2) applies the corresponding unitary transformations to restore reflection symmetry, and (3) decomposes the corrected coherency matrix into five physically meaningful components: surface scattering, double-bounce scattering, volume scattering, helix scattering, and compound-dipole scattering.Experiments are conducted using ALOS-2 and E-SAR fully polarimetric SAR data. Compared with several existing decomposition methods, the proposed PT5SD method effectively restores the reflection symmetry of target ensembles, achieves a reasonable redistribution of scattering power among different mechanisms within the scene, and highlights the dominant scattering characteristics of various land-cover types. These results indicate that PT5SD considerably suppresses depolarization effects and improves the interpretability of scattering mechanisms across complex scenes.关键词:PolSAR;coherency matrix;polarimetric decomposition;polarimetric orientation angle;unitary transformation;power transfer;depolarization72|115|0更新时间:2026-02-09
 - “介绍了其在点云配准领域的研究进展,相关专家提出了一种基于多特征关键点提取与相似三角形优化点对的点云配准方法,为解决复杂点云配准精度问题提供了新方案。”
 摘要:With the rapid development of computer vision and 3D laser scanning technology, point cloud data have been widely used in many fields, such as intelligent transportation, deformation monitoring, 3D reconstruction, and digitization of cultural relics, but many challenges exist in the collection process. Given the limitation in the viewing angle of laser scanning equipment and complex and changeable environmental factors, the integrity of the obtained point cloud data exhibits substantial defects, which directly affect the accuracy of subsequent processing and analysis. Therefore, efficient and accurate registration of point cloud data has become a crucial task.However, in existing point cloud registration algorithms, the calculation of point features usually adopts a fixed neighborhood, which is difficult to apply to the feature calculation of complex point clouds. This difficulty leads to problems, such as poor extraction results of keypoints and a large number of external points in the corresponding points, thereby affecting the accuracy of point cloud registration. To solve this problem, this study presents a point cloud registration method that uses multifeature keypoint extraction and similar triangle-based point pair optimization. The core task is extracting keypoints through the adaptive neighborhood strategy and optimizing the matching similarity model. First, the data are preprocessed by voxel filtering and hybrid filtering, the optimal neighborhood of the point cloud is determined using the characteristic entropy function, and the keypoints are extracted by combining the standard deviation of normal vectors’ angle anisotropy and curvature. Second, the signature of histogram of orientation is used to calculate the key features. Third, the bidirectional nearest neighbor distance ratio is employed to construct the initial matching point pairs, and a computational model on the basis of similar triangles is proposed to optimize the point pairs and complete rough registration. Finally, the point-to-plane Iterative Closest Point (ICP) algorithm with the angle constraint of normal vector is adopted to achieve accurate registration.Two experiments based on adaptive neighborhood keypoint extraction and point cloud registration are conducted to verify the effectiveness of the proposed method. In the adaptive keypoint extraction experiment, the Bunny, China Dragon, and Happy Buddha point cloud data sets collected from Stanford University and the Taoli Tripod, School Motto Wall, and School History Column point cloud data sets collected by our research group are used to extract keypoints. Results show that compared with LSP, ISS, Harris3D, and SIFT3D algorithms, the proposed method has better distinction between the sharp and smooth regions of the surface and better noise resistance. In the latter type of experiments, point cloud data from different perspectives are used for registration investigations. The proposed method has a smaller error compared with the point cloud registration algorithm combined with classic ICP, the keypoint-based four-point congruent set, and the point cloud registration method combined with sampling consistency initial alignment and ICP. In addition, the proposed method shows substantial advantages in the application of measured data registration.The experimental findings indicate that the proposed method exhibits a considerable improvement in registration accuracy compared with existing methods. This work provides the following innovative contributions. (1) An adaptive neighborhood keypoint extraction method called SDNVA-AC is proposed, and the SHOT feature is integrated to enhance the accuracy of feature extraction. (2) A registration strategy that combines BNNDR and the triangular similarity model is proposed to improve rough registration accuracy. (3) The point-to-plane ICP algorithm is improved by adding the angle constraint of normal vector, and the precision of fine registration is improved. This study can provide strong technical support and a theoretical basis for the research and application of multisource point cloud data fusion.关键词:remote sensing;Adaptive neighborhood;Point cloud registration;Similar triangle;Point to plane ICP178|307|0更新时间:2026-02-09
 - “四维高景三号01星宽幅相机采用32片TDI CCD视场拼接技术,实现了超大幅宽与亚米级分辨率的有效融合,在国土资源普查与应急灾害响应等应用中具有显著优势。专家设计了一种在轨几何定标方法,采用特征匹配结合模板匹配的策略,利用地面控制点与片间连接点联合解算内定标参数,试验表明定标后影像绝对定位精度优于3像素,相邻CCD影像间拼接精度控制在0.3像素左右,为提升多CCD视场拼接宽幅影像几何质量提供了有效解决方案。”
 摘要:The Gaojing-3 01 satellite (SVN301) is equipped with a wide-field-view (WFV) camera, which integrates 32 time‑delay integration charge‑coupled devices (TDI CCDs) per spectral band, covering a swath of 130 km with narrow overlaps of approximately 100 pixels between adjacent CCDs. Ensuring high absolute geolocation accuracy and seamless inter-CCD mosaicking under sparse ground control point (GCP) conditions is a critical challenge for wide-field photogrammetric applications. To address this issue, this study proposes a multi-CCD joint on-orbit geometric calibration method that integrates absolute and relative geometric constraints. The method applies a dual-step strategy of feature point matching followed by template-based refinement to automatically extract high-precision tie points in the narrow overlapping regions between CCDs. This approach captures subtle relative geometric discrepancies among CCDs that cannot be fully resolved by template matching alone, particularly in areas with complex surface topography or minor radiometric variations. Subsequently, a joint calibration model is formulated by treating uniformly distributed GCPs as absolute geometric references and the inter-CCD tie points as relative constraints. The model allows global optimization of the interior orientation parameters of all 32 CCDs simultaneously, ensuring a coherent and consistent geometric solution across the entire wide-field imagery.Extensive experiments are conducted using real SVN301 imagery in combination with high-accuracy RTK-surveyed control points to validate the proposed approach. Results demonstrate that the method effectively compensates for systematic geometric distortions inherent in the camera system and enhances absolute geolocation and relative inter-CCD consistency. After calibration, the absolute positioning accuracy of the SVN301 wide-swath imagery is higher than 3 pixels, confirming reliable georeferencing, and the inter-CCD mosaicking accuracy is controlled within 0.3 pixels, achieving seamless image integration and validating the effectiveness of internal geometric consistency control. The integration of sparse GCPs with inter-CCD tie points provides robust performance even in areas with limited ground reference coverage, highlighting the practical applicability of the method for operational satellite photogrammetry.In summary, the proposed multi-CCD joint geometric calibration method effectively addresses the challenges associated with wide-field TDI CCD cameras that feature multiple sensors with narrow inter-CCD overlaps. By integrating absolute GCP constraints with relative inter-CCD tie points, the method enables the design and implementation of an effective on-orbit geometric calibration procedure that compensates for systematic camera errors and relative inter-CCD distortions, thus achieving high absolute geolocation accuracy and superior inter-CCD mosaicking precision. Experimental results demonstrate that the method is reliable and feasible, and it can be used for operational on-orbit geometric calibration of wide-swath satellite imagery. This approach has remarkable potential for application in national land resource monitoring, emergency response, and other operational scenarios where geometric accuracy and internal image consistency are critical.关键词:SVN301;sub-meter resolution wide-field-view (wfv) camera;multi-ccd field-of-view stitching;on-orbit geometric calibration;relative constraints;absolute positioning accuracy;stitching accuracy131|643|0更新时间:2026-02-09
Models and Methods
- Postal code:100190
- Tel:010-58887052 Email:nrsb@aircas.ac.cn
- Technical support is provided by Beijing Founder electronics co., LTD 京ICP备20021838号-9
 京公网安备11010802024621
 - It is recommended to read the content of this site in Chrome&IE9+. Please switch to extreme mode in browser 360.
- Cookies We use cookies to help provide and enhance our service and tailor content. By continuing, you agree to the use of cookies.

0