
最新刊期
卷 29 , 期 4 , 2025
- “在热带气旋强度估算领域,深度学习技术取得突破,为提高精度和泛化能力提供新方向。”
 摘要:With the recent development of deep learning, remote sensing technology, and other related disciplines, research on tropical cyclone intensity estimation has made rapid progress. The data sources used have gradually expanded from single-channel data to infrared, water vapor, microwave, and other multichannel data. Intensity estimation methods have also developed from subjective estimation methods of manual feature extraction to objective estimation methods that rely on automation models with deep learning. This paper systematically summarizes and comments on the current research progress of tropical cyclone intensity estimation based on deep learning and briefly sums up the data sources and best track datasets used in intensity estimation algorithms based on deep learning. For future research, on the one hand, tropical cyclone intensity estimation methods should adapt to the development status of remote sensing big data, new theories and methods must be introduced in the field of deep learning, and multisource data should be comprehensively used to improve accuracy and generalization ability; on the other hand, attention should be paid to the meteorological characteristics and mechanism of tropical cyclones to improve the existing methods. In the future, under the background of big data, deep learning methods are expected to have a breakthrough in the field of tropical cyclone intensity estimation.关键词:tropical cyclone;deep learning;intensity estimation;convolutional network;multichannel data746|1547|0更新时间:2026-01-05
Research Progress

-
Near-surface soil freeze/thaw status datasets of China based on FY-3/MWRI data from 2010 to 2021 AI导读
“最新研究利用风云3B和风云3D数据,结合算法制备2010-2021年中国地表冻融数据集,精度超86%,为水文、气候等领域提供数据支持。” 摘要:Near-surface soil freeze/thaw (F/T) state is an important variable in water cycle and carbon cycle systems. Accurately obtaining the F/T state of near-surface soil and its spatial and temporal changes is important for research on hydrological processes, climate change, and ecology. The main existing F/T products based on passive microwave remote sensing data are unstable in large scale with relatively complex topography, climate, and soil conditions, and the accuracy has yet to meet the requirements of applications. The microwave radiation imager (MWRI) carried on China’s FY-3 satellite can acquire passive microwave remote sensing data and is currently less used in near-surface soil F/T monitoring. To address the problems of the existing near-surface soil F/T products, this study presented the near-surface soil F/T dataset of China from 2010 to 2021 based on the FY-3/MWRI data.Method The algorithms used to obtain the dataset consist of a primary and a secondary algorithm, i.e., the dynamic near-surface soil F/T detection algorithm and the seasonal threshold algorithm, respectively. The dynamic F/T detection algorithm is developed based on the union of soil F/T discriminant algorithm and edge detection algorithm and performs stably at large scales. To avoid evident F/T misclassification, corrected ERA5-Land temperature data were first used to identify areas that are not subject to F/T cycles before generating the near-surface soil F/T dataset. To reduce the effect of precipitation and water bodies on the accuracy of F/T dataset, precipitation is labeled using GPM precipitation data, and water bodies are labeled using land cover data (GlobeLand30-2010).Finally, the daily near-surface FY-3B (2010—2019) and FY-3D (2017—2021) F/T datasets consisting of daytime (ascending orbit) and nighttime (descending orbit) are presented. The in situ 5 cm soil temperature data obtained from the Qinghai-Tibetan Plateau, the Genhe watershed in Northeastern China, and the Saihanba area in Northern China were used to evaluate the FY-3B and FY-3D F/T datasets. The accuracy of the near-surface soil F/T dataset presented in this study is stable across seasons and climate zones and performs best when compared with the other existing passive microwave remote sensing F/T products. The overall accuracy of the presented F/T dataset is more than 86%.By analyzing the spatial and temporal variations of near-surface soil F/T from 2011 to 2020 based on the presented dataset, we found that the annual thaw onset was delaying, the annual frozen onset was advancing, and the annual frozen days was increasing during the 10-year period over the Qinghai-Tibetan Plateau, whereas no considerable change was observed over other regions. The vegetation Net Primary Productivity (NPP) and Gross Primary Productivity (GPP) were negatively correlated with the land surface annual thaw onset date and annual frozen days, with the coefficient of determination ranging from 0.52 to 0.72. The earlier the date of land surface thawing and the fewer the annual frozen days, the higher the annual NPP/GPP. These analyses demonstrated the potential application of this presented F/T dataset in studies of climate change, vegetation biomass, and vegetation carbon stocks. The dataset is stored in H5 file format and can be downloaded at DOI:10.11888/Crvos.tpdc.300445.关键词:near-surface soil freeze/thaw status datasets;FY-3B;FY-3D;microwave radiation imager;dynamic near-surface soil freeze/thaw detection algorithm452|751|0更新时间:2026-01-05
 - “在高标准农田建设领域,专家构建了首套高分遥感影像农村道路提取基准数据集WHU-RuR,为农村道路提取提供解决方案。”
 摘要:High-standard farmland construction is a crucial initiative in enhancing grain production capacity and ensuring food security in China. Rural roads, including field paths and production routes, are the core components of the infrastructure for high-standard farmland construction. The rapid and accurate extraction of rural roads from high-resolution satellite imagery is crucial to monitoring and regulating high-standard farmland construction.We systematically constructed the first benchmark dataset for rural (high-standard farmland) road extraction from high-resolution satellite imagery (WHU-RuR) in this study. This dataset collected high-resolution satellite images covering typical rural areas in seven provinces (Hubei, Hunan, Shaanxi, Sichuan, Anhui, Henan, and Hebei) in different regions of China. These images were uniformly annotated manually. The training set and the test set consisted of 25922 pairs of high-resolution satellite images and road samples, with a spatial resolution of 0.3 m and a spatial size of 1024×1024 pixels. At the same time, experiments were conducted using state-of-the-art deep learning methods in the road extraction task.The constructed WHU-RuR is currently an open-source dataset with the highest farmland coverage, the richest rural road categories, the most complex rural background, and the largest amount of data. However, the current deep learning road extraction method still has the problem of poor extraction effect for rural roads. In future research, the rural road extraction method based on the WHU-RuR dataset can conduct in-depth research on the unique challenges of large intraclass differences in rural roads, maintenance of road connectivity, foreground-background category imbalance, and foreground-background spectral similarity.This study constructed the first high-resolution remote sensing image of a rural (high-standard farmland) road extraction benchmark dataset (WHU-RuR). To verify the usability of the WHU-RuR dataset, this study tests and comprehensively analyzes the effect of deep-learning road extraction methods on rural road extraction tasks. Results indicated that the WHU-RuR dataset satisfies the basic requirements for rural road extraction and has remarkable potential applications in the monitoring and regulation field of high-standard farmland. The dataset can be accessed at https://doi.org/10.57760/sciencedb.09181.关键词:Rural road extraction;high-standard farmland;high spatial resolution remote sensing;benchmark dataset of remote sensing;deep learning1018|873|0更新时间:2026-01-05
Data Articles
- “在山区积雪监测领域,专家利用U-Net++网络融合多源数据,开发出30米分辨率逐日积雪面积重建算法,有效提高精度,对径流模拟、水储量估算和灾害防治具有重要意义。”
 摘要:High spatial and temporal resolution snow cover remote sensing range data are the key driving data for hydrological simulation. The accuracy of snow cover range directly determines the reliability of simulation results. Existing snow range remote sensing products, limited by sensor performance, often cannot achieve high temporal and spatial resolution and are stretched when facing highly spatially heterogeneous patchy snow distribution. As an important driving data for hydrological simulation, daily snow cover extent data with a spatial resolution of 30 m is crucial to improving the accuracy of basin-scale hydrological simulation. The purpose of this study is to prepare 30 m daily high-precision snow coverage data in the Qilian Mountains, in order to achieve dynamic monitoring of spatiotemporal changes in snow cover area.This study used the U-Net++ deep learning network to predict the snow cover range with high spatiotemporal resolution. First, the Landsat 8 SR reflectance data at the previous time t1 and the MOD09GA reflectance at t1 and t2 were resampled, and the pixels were matched.
 - “格陵兰北部冰前河网遥感数据集揭示冰面融水汇流特征,为研究冰盖物质平衡和北极海洋环境影响提供数据支撑。”
 摘要:Each summer, proglacial river networks develop in northern Greenland and can route large volumes of surface meltwater into the ocean, acting as important meltwater connections between the ice sheet and the ocean. However, the spatial distribution and geomorphology of the proglacial river networks in northern Greenland remain unclear. On the basis of 10 m resolution Sentinel-2 satellite images and 30 m resolution Copernicus DEM, this study maps proglacial water on the northern Greenland (with an area of 100,132 km2) in 2020 using an automatic water remote sensing information extraction algorithm constrained by routing.First, river features are enhanced from the image background by using a modified normalized difference water index, a Gabor filter, and a path opening operator. Second, the Area Of Interest (AOI) for rivers is constructed to reduce the interference of bare ground and shadow features by combining the height above the nearest drainage AOI and topographic depressions. Third, the derived water mask is interested with DEM-modeled drainage networks to delete pseudo drainage channels, to generate continuous, realistic drainage networks, and to classify proglacial river networks and isolated lakes on the basis of their morphometric characteristics. Finally, proglacial river networks are connected by using continuous DEM-modeled drainage networks to produce the dataset of 10 m resolution continuous proglacial river networks and isolated lakes.Our mapping results show the spatial distribution of proglacial river networks, compare four water remote sensing datasets (Dynamic World V1, CALC-2020, Esri Land Cover, and ESA WorldCover), and quantitatively analyze the length, width, area, drainage density, and order of river networks. Our results indicate the following: (1) This study accurately extracts and divides remote sensing information of the proglacial river networks and isolated lakes, and the overall accuracy of river network remote sensing information extraction is 93%±2%, which is better than the four comparison datasets (overall accuracy of 83%—89%). Our results can accurately reflect the spatial distribution of the proglacial river networks in the study area, especially small rivers during the melting period. (2) In 2020, a total of 995 proglacial river networks, covering a total water area of 1832.6 km², developed in northern Greenland and could route 90.5% of total surface meltwater runoff into the ocean. (3) Proglacial river networks have considerable network order difference ranging from 1 to 5. Order 1—2 river networks account for over 84% river networks, whereas the limited number of 40 (<5%) order 4—5 high-order river networks dominate the length of river networks (52.9%), water area (63.9%), catchment area (54.1%), and the routing of surface meltwater runoff (69.3%).This study produces a high-resolution proglacial water dataset with large spatial coverage, making up for the lack of precision of the existing datasets, and shows the overall distribution of the large-scale proglacial river networks. Our findings reveal that the widely distributed proglacial river networks in northern Greenland are dominated by high-order river networks and substantially route surface meltwater, thereby improving our understanding of meltwater routing from the supraglacial to proglacial regions in northern Greenland.关键词:proglacial rivers;proglacial lakes;river networks;river network order;Greenland ice sheet;Remote sensing dataset;DEM drainage network;river and lake classification;accuracy verification450|1076|0更新时间:2026-01-05
 - “中国海洋一号C/D卫星搭载的海岸带成像仪和水色水温扫描仪,为海冰精细化监测提供技术支持。研究评估了卫星数据对海冰识别和密集度估算的效能,提高了海冰覆盖面积估算精度。”
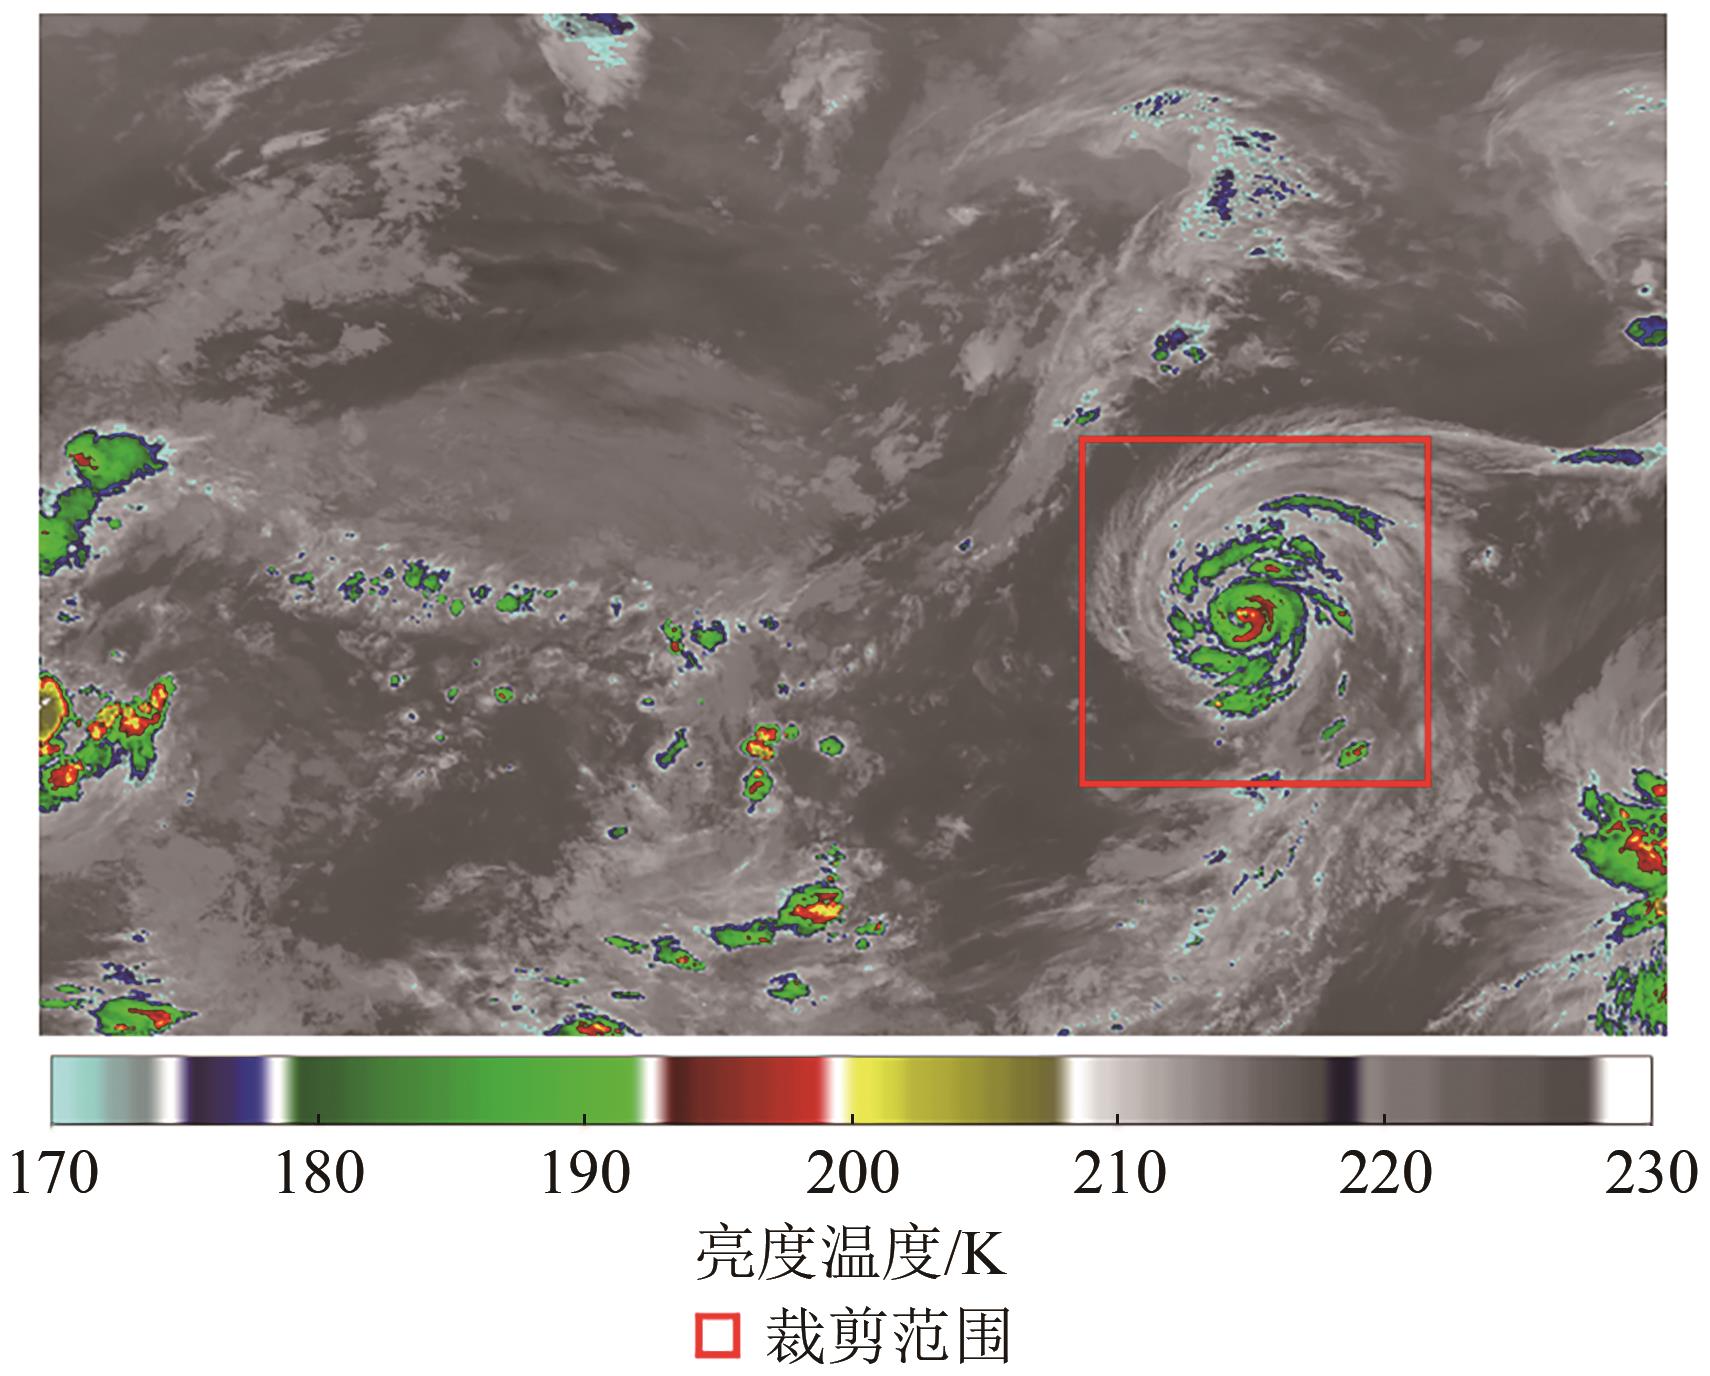
 摘要:Sea ice represents a typical natural phenomenon that affects the marine and coastal environment in North China; thus, it is the focus of marine environment monitoring. Timely and accurate remote sensing data about sea ice is crucial for emergency treatment and recovery. Various remote sensing technologies have been applied to sea ice monitoring, with Sea Ice Concentration (SIC) serving as a key parameter indicating the spatial distribution characteristics of sea ice. Among these, optical remote sensing is frequently used. However, sea ice and different types of clouds (i.e., cirrus and cumulus) have similar reflection characteristics in Visible and Near-Infrared (VNIR) wavelengths, thus posing great difficulties for the optical extraction of sea ice. Haiyang-1C/D (HY-1C/D) satellites are the first operational ocean color satellites of China, and both of them are equipped with a Coastal Zone Imager (CZI) and the Chinese Ocean Color and Temperature Scanner (COCTS), which can technically support the fine and dynamical monitoring of sea ice due to their wide coverage and high spatiotemporal resolution. In addition to the VNIR bands (412—865 nm), the onboard COCTS sensor can interpret the thermal characteristics of targets, which would help distinguish between sea ice and clouds. In this study, Liaodong Bay of the Bohai Sea is selected as the study area, and synchronous CZI and COCTS images covering Liaodong Bay from December 2021 to March 2022 are collected and analyzed. The main objective of this study is to verify the feasibility of HY-1C/D satellites to detect sea ice, especially the image characteristics of typical targets (i.e., sea ice, seawater and clouds) in optical (i.e., VNIR) and thermal infrared bands. Using the Brightness Temperature (BT) difference between sea ice and cloud in the thermal infrared band of COCTS, sea ice and cirrus clouds can be preliminarily separated. However, the difference in BT between sea ice and cumulus clouds is minimal, which can be further separated in accordance with the NIR-red reflectance ratio. In addition to the sea ice identification, the application of SIC can effectively unmix ice-water pixels and improve the estimation accuracy of the sea ice coverage area for optical images with different spatial resolutions. The above results can confirm the capability of HY-1C/D satellites in sea ice detection. Therefore, HY-1C/D satellites can provide reliable data and improve the monitoring of sea ice.关键词:HY-1C/D satellites;sea ice;spectral features;brightness temperature;cloud detection;Sea Ice Concentration (SIC)239|474|0更新时间:2026-01-05
 - “最新研究显示,SWOT卫星在青藏地区湖泊观测中具有高精度潜力,为全球气候变化研究提供新视角。”
 摘要:Lakes, known as “sentinels” of global climate change, are key contributors to the worldwide water cycle. Accurately estimating lake water storage and its fluctuations is crucial to forecasting global climate change. The Surface Water and Ocean Topography (SWOT) mission, launched in December 2022, offers comprehensive observations of the world’s lakes, providing a major advancement in our understanding of lakes on a global scale. To utilize SWOT data in the future, this study conducts simulations and evaluates the application potential in lake storage estimation of SWOT mission. We generate SWOT lake data, estimate the simulated water storage of four lakes located on the Qinghai-Tibet Plateau, analyze the errors of lake water storage derived from SWOT simulation data, and suggest necessary considerations for future use of SWOT mission in estimating lake water storage. By addressing these issues, we hope to offer valuable insights for more accurate utilization of SWOT data in estimating lake water storage in the future.In this experiment, we employed the CNES SWOT hydrology toolbox to generate simulated data of lakes. The toolbox contains three primary components: large-scale simulator, RiverObs, and LOCNES. The tool computes the lake extent data intersected by the SWOT wide swath. Subsequently, the tool generates point cloud data within the overlapping area. Each point cloud dataset contains detailed information, including the water surface height. Next, the RiverObs tool was employed to create SWOT river data in shapefile format. Finally, the LOCNES tool was used to generate lake data from the data not categorized as part of the river system.The National Tibetan Plateau Scientific Data Center (TPDC) provides bathymetry point data for four lakes. This study uses Topo to Raster in ArcGIS to generate the lake bathymetry. In addition, this study uses the global lake bathymetry GloBathy. We used the true maximum depth data of four lakes provided by the TPDC to regenerate modified GloBathy data. In summary, this experiment obtained three sets of lake bathymetry data of four lakes, including true bathymetry (tru), initial GloBathy (ori), and modified GloBathy (mod).Last, this study used the SWOT-simulated data to estimate the lake water storage. We analyzed the effect of errors in SWOT mission on lake storage estimation. In the SWOT PIXC data, the errors of majority of water surface elevation measurements are less than 1 m. After averaging at the scale of the lakes, the errors were mostly within 0.02 m. The error of the water surface height measured by most SWOT point clouds was less than 1 m. The correlation coefficient between the simulated water surface height sequence of the SWOT mission and the real sequence exceeded 0.9, indicating that the SWOT mission can well reflect the seasonal changes in the lake water surface height. The relative error in estimating lake area from SWOT observations was less than 10% due to the dark water effect. In this study, SWOT-simulated data were used to estimate lake water storage using three types of lake bathymetry. It showed that the errors in water surface elevation had a relatively small effect on the accuracy of lake water volume estimation, while the errors in estimating the lake topography had a more considerable effect on the accuracy of lake water volume estimation.The research indicates that the SWOT mission has remarkable prospects for lake water volume estimation. Obtaining higher-precision prior data on lake depths is critical for improving accuracy in lake water storage estimation in the future. In the future, we can combine SWOT mission data with other hydrological satellite data and surface measurement data to obtain more accurate water storage changes in surface water.关键词:Tibetan Plateau;Surface Water and Ocean Topography (SWOT);CNES hydrology simulator;lake area;lake water storage;lake bathymetry819|1333|0更新时间:2026-01-05
Remote Sensing of Cryosphere
- “最新研究揭示鄂尔多斯市光伏电站土地利用演变,为当地土地规划和资源管理提供科学依据。”
 摘要:Photovoltaic power stations, which generate electricity using solar radiation, are an important form of clean energy. However, current research generally lacks in-depth investigation into the long-term land use evolution of photovoltaic power stations and has not systematically predicted photovoltaic construction under different policy scenarios. Therefore, thoroughly exploring the changes in area, type conversion, and spatial distribution characteristics of photovoltaic power stations in Ordos from 2000 to 2023, and on this basis, predicting future land use types under different policy scenarios are of remarkable scientific importance.To achieve these objectives, this study utilized visual interpretation techniques on satellite imagery from Landsat 5 and GF-2, covering the years 2000—2023. From these images, land use type maps were generated, which enabled us to track changes in land use over time. Specifically, we examined the spatiotemporal characteristics of photovoltaic power stations, conducting an analysis every five years to determine shifts in spatial patterns. This analysis was conducted using Gaussian projection ellipses, a method that allowed us to capture the spatial distribution trends of these stations. In addition to this spatial analysis, we employed the Patch-generating Land Use Simulation (PLUS) model, which integrates natural and socioeconomic driving factors to predict future land use patterns under different policy conditions. Key driving factors included population growth, surface temperature, soil heat flux, precipitation, and changes in policy, which are critical elements in understanding the evolution of photovoltaic stations over time and their future development.The findings of this study are multifaceted and provide valuable insights into the evolution of photovoltaic power stations in Ordos. (1) The overall spatial pattern of land use remained relatively consistent between 2000 and 2011 and between 2011 and 2023. However, a noticeable shift occurred starting in 2011, when certain land types, such as desert sand and grassland, began to be converted into photovoltaic power station sites. (2) From 2011 to 2023, a clear shift in the spatial distribution of these stations occurred, with the main area of photovoltaic development moving from the northwest to the northeast of Ordos. Additionally, the types of land being used for these constructions evolved, with an increasing trend of converting grassland areas for photovoltaic station use. (3) The analysis using the PLUS model revealed that several key factors were driving these land use changes, including population growth, surface temperature, soil heat flux, precipitation, and most notably, policy decisions. Policy, in particular, emerged as one of the strongest determinants in the development and expansion of photovoltaic stations in the region. (4) Projections for land use changes in 2030 under three different policy scenarios show that regardless of the specific scenario, areas allocated to buildings, forests, water bodies, arable land, grassland, and photovoltaic power stations will likely continue to expand. These findings provide important insights into the future changes of photovoltaic power stations in Ordos.This study sheds light on the spatial and temporal dynamics of photovoltaic power station development in Ordos, highlighting the complex interplay between population growth, environmental factors, and policy decisions in shaping land use changes. Results not only demonstrate how land use has evolved over the past two decades but also provide predictive insights into how it may continue to change by 2030 under different policy scenarios.关键词:remote sensing;Photovoltaic power stations;spatial pattern;spatio-temporal variability;driving factors;scenario simulation916|892|1更新时间:2026-01-05
 - “在森林火灾模拟领域,专家利用遥感数据和林火蔓延模型,对比分析了Cell2Fire和FARSITE两种模拟器的模拟精度,并提出了一种过火区重初始化方法,有效提高了连续多天的模拟精度。”
 摘要:The utilization of remote sensing data for forest fire spread simulation is predicated on the acquisition of critical information such as combustibles, topography, and ignition points through remote sensing technology. These data, when integrated with forest fire spread models, are pivotal for predicting the trajectory of forest fires and serve as a vital reference for forest fire prevention and emergency response operations. This study harnesses two fire spread simulation tools, Cell2Fire and FARSITE, to simulate two forest fire events occurring in the Liangshan of Sichuan and the Naji Forestry Site in Inner Mongolia, comparing the precision of these simulators.Addressing the challenge of suboptimal accuracy in continuous simulations, the study proposes an innovative reinitialization method for burned areas. This method is based on the Burned Area Index (BAI) spectral index combined with region-growing approach. The study compares the simulation precision of FARSITE and Cell2Fire across three methodologies: continuous simulation, VIIRS reinitialization, and the proposed burned area reinitialization.In the Liangshan fire simulations, Cell2Fire projected a faster spread of fire compared with FARSITE, although FARSITE consistently outperformed Cell2Fire in simulation accuracy across all methods. In the simulations for the Naji Forestry Site, FARSITE’s VIIRS reinitialization and burned area reinitialization methods yielded higher precision than Cell2Fire, but its continuous simulation accuracy considerably diminished and underperformed relative to Cell2Fire. When comparing the accuracy of the three simulation methods, the SC values and confusion matrix indicators showed a general agreement, with the higher precision outcomes predominantly emerging from the burned area reinitialization method applied during the mid to later stages of the fires, with most SC values and F1 scores exceeding 0.8.The conclusions of this study are as follows (1) The simulation outcomes from FARSITE and Cell2Fire show minor discrepancies, with FARSITE demonstrating superior accuracy in most scenarios compared with Cell2Fire. (2) Utilizing the BAI and regional growth methodologies enables the automatic extraction of burned areas. This approach is not only simple and reliable in extracting results but also saves time and labor costs, making it more suitable for practical applications in forest fire spread simulations. (3) The reinitialization method for burned areas, which integrates automatically extracted burned areas with VIIRS fire spot data for forest fire spread simulations, remarkably enhances the mitigation of issues related to insufficient fire spots in the early stages of a fire and the accumulation of errors during prolonged simulations. The simulation outcomes utilizing this method exhibit the highest accuracy within the simulations conducted by Cell2Fire and FARSITE, suggesting that the selection of an appropriate simulation approach may be more crucial to improving the accuracy of simulation results than the choice of a forest fire spread simulator.关键词:FARSITE;Cell2Fire;VIIRS;forest fire;fire spread simulation;“5·7” Liangshan fire;“5·17” Naji fire559|1198|1更新时间:2026-01-05
 - “卫星遥感技术助力长江中游水文干旱监测,揭示水体面积变化与干旱响应关系,为区域水文干旱评估提供新视角。”
 摘要:Under the influence of global climate change and human activities, the frequency and intensity of drought have increased, posing challenges to food, ecology, and water security. Using satellite remote sensing technology for rapid acquisition, comprehensive coverage, and high-precision monitoring of surface water is crucial to understanding the mechanisms and evolution of hydrological drought. With the continuous expansion of global dynamic surface water coverage products, a valuable opportunity to explore the response relationship between surface water dynamics and drought emerges. This study focused on the middle reaches of the Yangtze River and its 4683 sub-basin units, utilizing the Global Surface Water Dynamic dataset to quantify abnormal changes in seasonal surface water areas from 1999 to 2020 through the Dynamic Surface Water Index (DWI). It aimed to investigate the response relationship between hydrological drought and meteorological drought from the perspective of dynamic surface water area, conducting an analysis of its uncertainties. Results showed the following: (1) DWI effectively depicted changes in the wet/dry status of the middle reaches of the Yangtze River and its sub-basin units. From 1999 to 2020, the fluctuations of DWI time series and SPI time series in the middle reaches of the Yangtze River are basically the same, which can capture the effects of most of the extreme hydrological and climatic events on the dynamic ranges of surface water in the region. The fluctuations of the DWI time series show significant positive correlations with the SPI time series at the four time scales (1, 3, 6, and 12 months), with the highest correlations with the SPI6 (r = 0.484, p < 0.01). Approximately 88.2% of the 4,683 sub-basin units showed a significant positive correlation between DWI and SPI, with response times predominantly between 6 and 12 months. (2) The study also uncovered uncertainties in the correlations between DWI and SPI, primarily stemming from two key factors. The quality of raw data posed a challenge, marked by insufficient seasonal surface water area coverage and limited observed data, potentially leading to the degradation of correlations. The HANTS algorithm combines smoothing and filtering techniques to identify, remove, and fill in outliers in time series data effectively. The data reconstructed on the basis of HANTS effectively improved the monitoring effect of DWI, but it could not completely eliminate the impact of data quality. Second, the complex interplay of meteorological droughts at local and upstream basins considerably influenced surface water in the sub-basins. Consequently, as the statistical analysis expanded to larger basin scales, the direct effect of meteorological factors on basin water bodies strengthened, resulting in a more pronounced correlation. The methodology employed in constructing hydrological drought monitoring indicators, with sub-basins as monitoring units and dynamic water bodies as monitoring data, not only offers invaluable insights for regional and global hydrological drought monitoring and assessment but also underscores the pivotal role of remote sensing dynamic water products in advancing these endeavors.关键词:remote sensing;Dynamic Surface Water;Hydrological Drought;meteorological drought;the middle reaches of the Yangtze River;drought index591|698|0更新时间:2026-01-05
 - “在辐射传输建模领域,专家基于随机辐射传输理论开发了三维解析辐射传输模型ESRT,为复杂森林场景监测提供理论基础。”
 摘要:The complicated spatial heterogeneity in forest scenes may have an effect on canopy reflectance. How to address heterogeneity is a challenge in the field of radiative transfer modeling. To overcome the accuracy limitations of classical analytical models caused by simplified scenarios and the efficiency limitations of computer simulation models in large-scale applications, we developed a three-dimensional analytical radiative transfer model called ESRT based on stochastic radiative transfer theory. At present, the application of ESRT in different complex forest scenes still needs to be explored, and additional field data are essential for model verification.This study introduces the basic principles and input–output parameters of the ESRT model, in which two key input parameters were proposed to express different heterogeneous canopy structures: (1) the intercanopy heterogeneity index (yr), representing the ratio of tree crowns with different optical properties to the total number of trees; (2) the intracrown heterogeneity index (yi), denoting the ratio of elements with different optical properties within a single tree crown to the total number of elements. To evaluate the model performance in simulating different kinds of heterogeneous forest canopy spectra, 21 30 m×30 m sample plots in mixed forests and 50 10 m × 10 m quadrats in pest-damaged forests were set up with individual tree measurements and remote sensing data acquirements. Control experiments based on the original SRT model and the three-dimensional model LESS were conducted for the two cases to compare simulation results with the extended ESRT model. On the basis of the framework of ESRT, sensitivity analyses were conducted to reveal the effect of mixing and pest levels on forest canopy spectra.Results showed that compared with the original SRT model simulations, the canopy spectra simulated by the extended ESRT model have better consistency with the measured spectra from the sample plots for the cases of mixed forests (R2=0.77, RMSE=0.075) and pest-damaged forests (R2=0.64, RMSE=0.039), and the simulation accuracy is closer to that of a 3D computer model. The conifer–broadleaf ratio and the vertical distribution of damaged foliage can affect the canopy spectral signals. In mixed forests, the canopy NDVI decreases with the decrease in forest coverage and with the increase in coniferous tree species proportion. Canopy coverage is the main factor affecting NDVI when the coverage is low, but the effect of mixing on NDVI becomes more apparent when the coverage is high. In pest-damaged forests, the sensitivity of BRF to yi varies considerably with damage types. The BRF of the bottom damaged forest exhibits a slight change at reduced yi and then shows a sharp change toward the maximum of yi. On the contrary, the BRF of the top damaged forest changes dramatically at reduced yi but levels off at increased yi.The three-dimensional analytical model ESRT balances the simulation accuracy of three-dimensional structures with the simulation efficiency of classical analytical models, resolving the difficulty in accurately and efficiently simulating radiation transfer in the presence of heterogeneity. The computation time is suitable for large-scale heterogeneous forest canopies. The extended ESRT can simulate forests with mixed canopy types and heterogeneous leaf distribution structures within the canopy, potentially aiding forest managers in more accurately and effectively monitoring forest dynamic changes.关键词:remote sensing;radiative transfer;three-dimensional analytical model;heterogeneous forest canopy;Mixed Forest;forest pest402|1613|0更新时间:2026-01-05
 - “卫星遥感技术助力中国化石能源碳排放核算,揭示新兴及小型排放源,为“双碳”目标实现提供技术支持。”
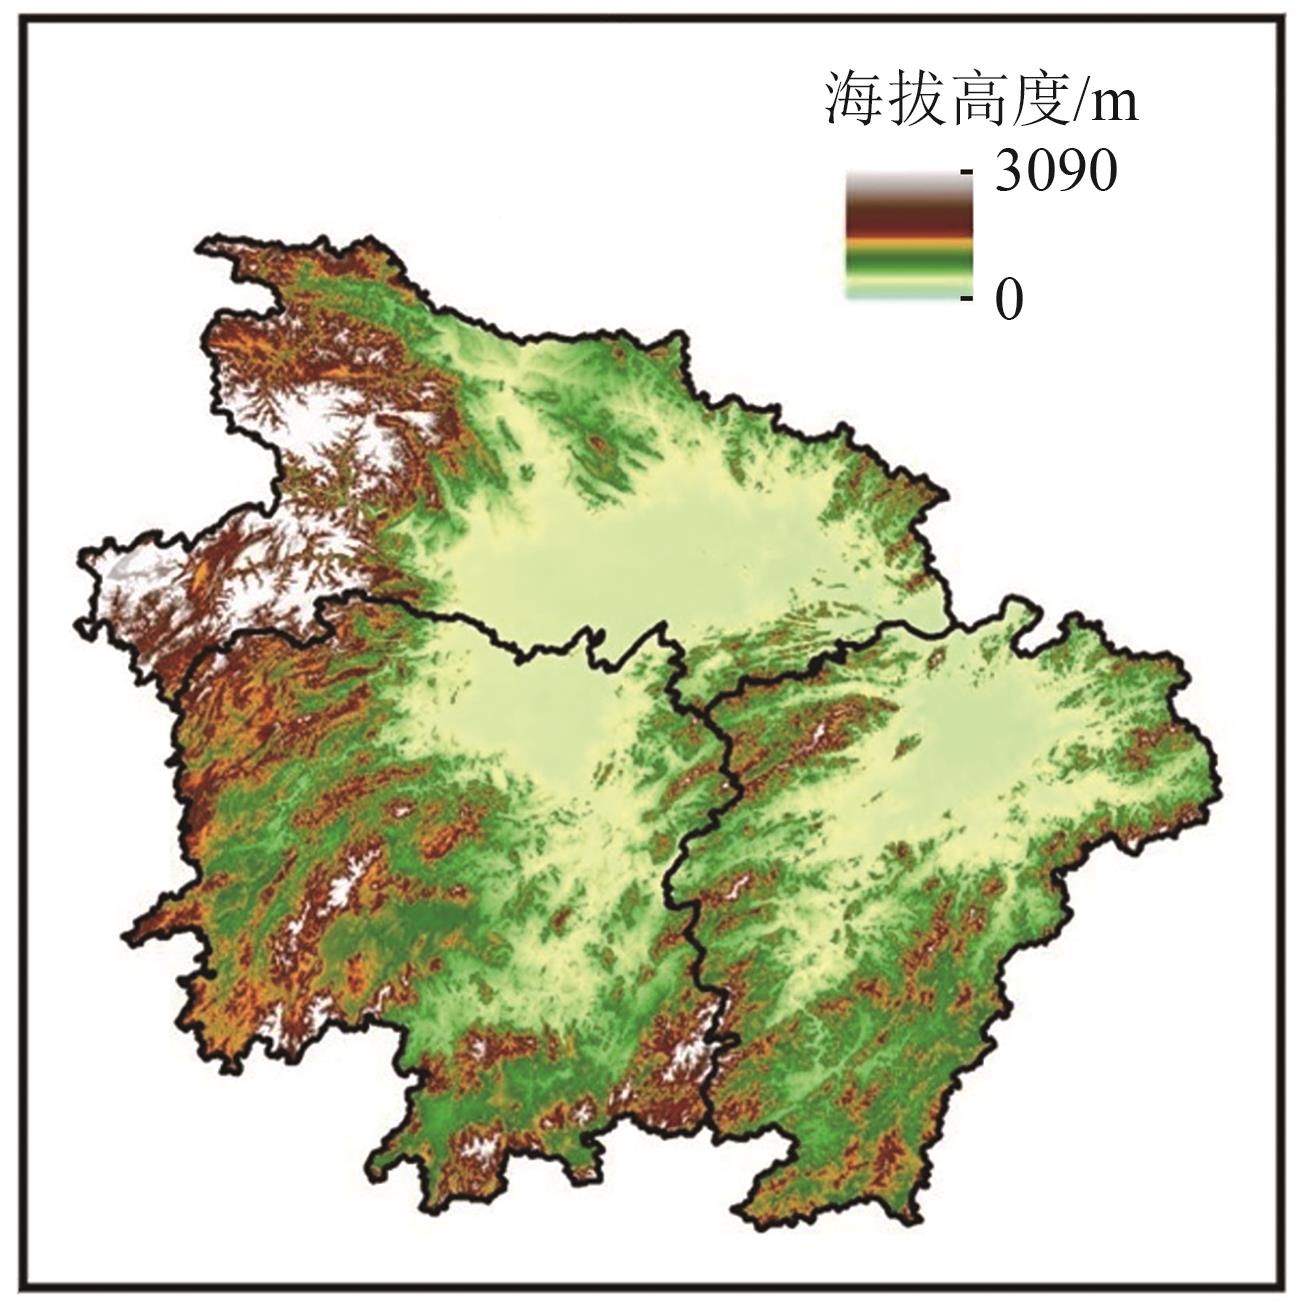
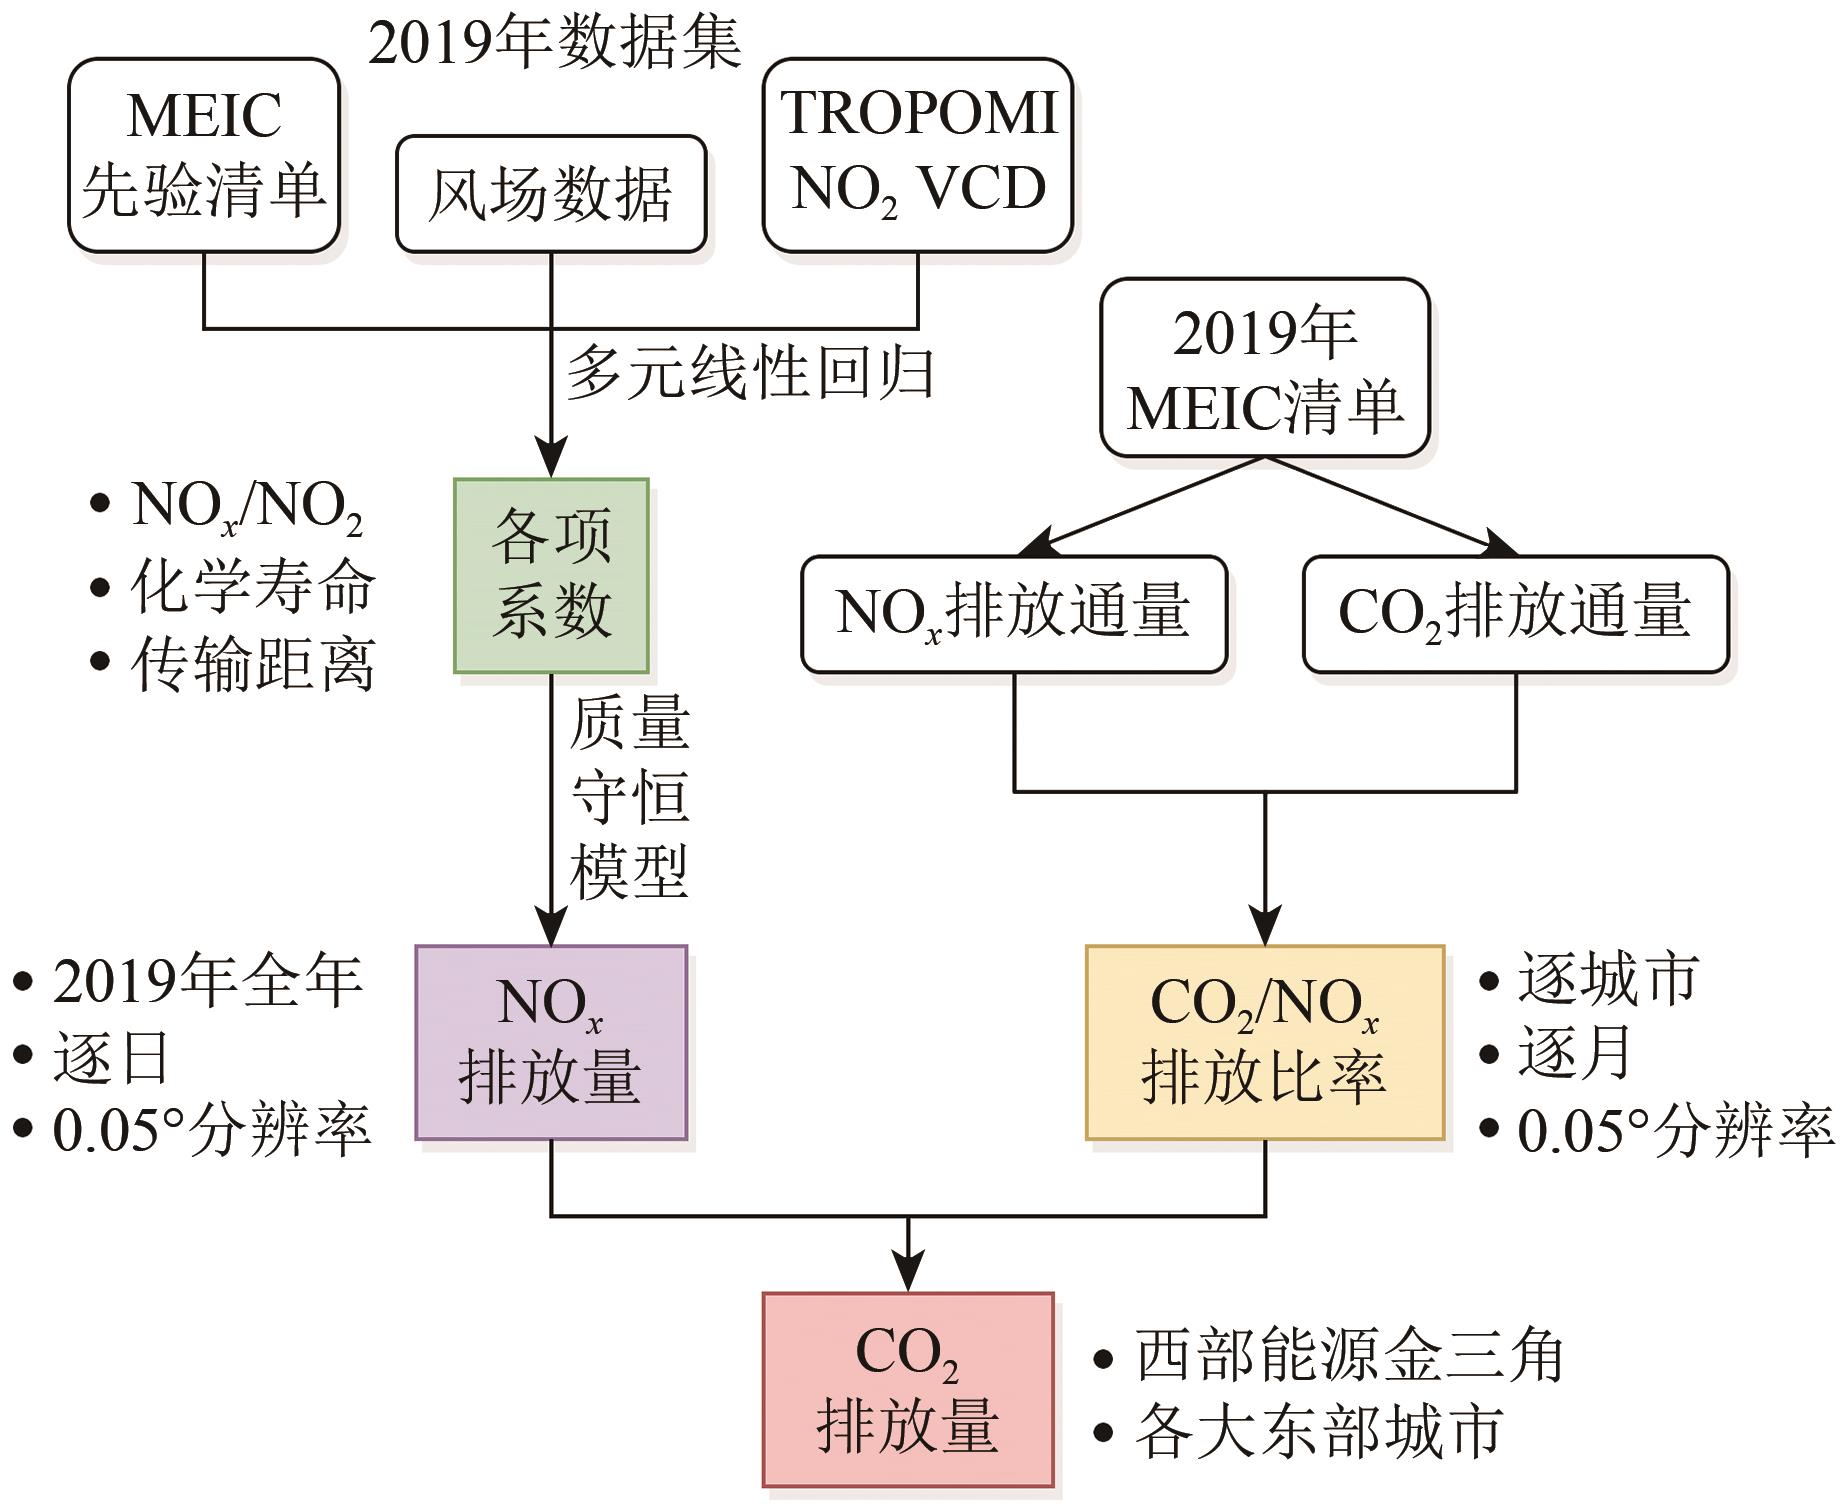 摘要:Anthropogenic emissions, primarily resulting from the combustion of fossil fuel, have led to a rapid and accelerating rise in atmospheric carbon dioxide (CO2) concentration in recent decades. Utilizing satellite remote sensing technology is crucial to estimating CO2 emissions from fossil fuel consumption, which is essential for achieving the “dual carbon” targets. However, the long lifetime of CO2 makes it challenging to estimate CO2 emissions directly from satellite measurements, and the existing CO2 satellite sensors have insufficient spatial resolution. Considering that fossil fuel combustion emits CO2 and nitrogen oxides (NOx), the lifespan of NOx is much shorter and the feasibility of estimating its emissions through satellite remote sensing is favorable. Therefore, this study aims to estimate daily CO2 emissions indirectly on the basis of TROPOMI NO2 observations.In this work, we focus on 28 eastern cities and one western energy-intensive region, known as the “Energy Golden Triangle,” to estimate daily CO2 emissions from fossil fuel consumption indirectly based on TROPOMI nitrogen dioxide (NO2) column concentrations. Our methodology has three steps: First, we utilize TROPOMI observations of NO2 tropospheric column concentrations and inverts the daily NOx emissions in 2019 based on a mass-conserving model free approximation of emissions (MCMFE) approach. This approach is proposed by the authors’ team on the basis of the principle of atmospheric component mass conservation. Second, the Multiresolution Emission Inventory for China (MEIC) is employed to compute and analyze the emission relationships between CO2 and NOx. Finally, this work estimates the daily CO2 emissions from fossil fuel consumption in these regions by using the NOx emission (MCMFE-NOx) and CO2–NOx ratio computed.This work analyzes the estimation results of 28 eastern cities and three type of sources (power plants, iron and steel factories, and coal mines) in the Energy Golden Triangle separately. The findings indicate that the estimations align with the spatial distribution of CO2 emissions in the MEIC inventory yet offer higher spatial resolution and temporal frequency, revealing emerging and smaller emission sources missed in the inventories. In 28 eastern cities, remarkable emerging emission sources have surfaced in suburban areas due to recent urbanization expansion and economic development, exhibiting substantial emission volumes. For instance, in eastern cities such as Beijing, remote sensing estimations in suburban areas exceeded the MEIC inventory by approximately 104%, indicating the emergence of numerous new emission sources accompanying the rapid expansion of these urban centers. In the Energy Golden Triangle, small-scale power plants and industrial sources are overlooked in the MEIC inventory in places such as Baotou, Yulin, Yinchuan, and Wuzhong. Exemplified by Yulin, estimations from grids containing power plants, steel factories, and coal mines surpassed the MEIC inventory by approximately 41%, indicating that some small power plants and industrial sources not included in the emission inventory were captured through satellite remote sensing.This study combines the NOx emission and uncertainty results with the “bottom-up” CO2–NOx emission ratio and derives the daily CO2 emission estimation results of the study areas in 2019 (whole year). It performs a statistical analysis of emissions in 28 large cities and in sources in the Energy Golden Triangle. The findings indicate that the estimations align with the spatial distribution of CO2 emissions in the MEIC inventory yet offer higher spatial resolution and temporal frequency, revealing emerging and small emission sources missed in the inventories. This study provides technical support for carbon emission accounting related to fossil fuel consumption in China.关键词:remote sensing;Fossil fuel consumption;NOx;CO2;TROPOMI;MEIC Inventory;Indirect estimation;Mass-conserving approach;Emerging emission sources560|1173|0更新时间:2026-01-05
Ecology and Environment
- “遥感图像实例分割领域取得新进展,专家构建了先验信息驱动体系,提出了基于多重先验驱动的弱监督实例分割网络,为遥感图像细粒度解译提供高性能低成本解决方案。”
 摘要:Remote sensing image interpretation has essential application values in various fields, such as urban management, maritime monitoring, and resource planning. As an important and challenging task in remote sensing image interpretation, instance segmentation of remote sensing images can achieve target-level localization and pixel-level classification of objects of interest with fine granularity, making it a current research hotspot. However, most existing remote sensing image instance segmentation methods adopt the fully supervised paradigm and require expensive pixel-level labels. Moreover, remote sensing images often have issues such as mixed foreground and background and complex target contours, making segmentation challenging.To overcome these challenges, we propose a prior information-driven system suitable for weakly supervised instance segmentation tasks in remote sensing images and a multiprior driven weakly supervised instance segmentation network (MPD-WSIS-Net) to address these challenges. The prior information of weakly supervised instance segmentation can be divided into task prior and image prior. The task prior mainly comes from the bounding box detection task, which is closely related to instance segmentation. Specifically, the study obtains prior information from three components: box–mask projection consistency constraint, pixel discrimination difficulty representation function, and center position prior constraint. The image prior comes from summarizing or excavating information about the image itself. In this study, we focus on the relationships between neighboring pixels in the image and the gradient information of targets. By integrating these constraints and the pixel discrimination difficulty representation function, we establish a complete prior information driving system to enable MPD-WSIS-Net effectively to perform instance segmentation tasks under weakly supervised conditions in remote sensing images.MPD-WSIS-Net was compared with weakly supervised methods, hybrid supervised methods, and fully supervised methods on optical and SAR remote sensing image datasets. Compared with weakly supervised methods, MPD-WSIS-Net achieved improved segmentation results. Compared with hybrid supervised methods, the segmentation performance of MPD-WSIS-Net on optical and SAR remote sensing image datasets considerably surpasses that of Mask R-CNN and CondInst of 50% pixel-level annotations. It is also competitive compared with Mask R-CNN and CondInst under 75% pixel-level annotation conditions. Compared with fully supervised methods trained with pixel-level labels, MPD-WSIS-Net can achieve 89.3% of fully supervised Mask R-CNN’s AP value on optical and 84.3% on SAR remote sensing image datasets. Furthermore, we have demonstrated the positive impact of each prior information component in MPD-WSIS-Net on instance segmentation performance in optical remote sensing images through ablation experiments.This study constructs a prior information-driven system consisting of task and image priors through a detailed analysis of the prior information in weakly supervised instance segmentation tasks. The specification of prior information is achieved through the box–mask projection consistency constraint, pixel discrimination difficulty representation function, center position prior constraint, neighborhood visual consistency constraint, and gradient consistency constraint. This research can enable MPD-WSIS-Net to complete instance segmentation tasks without pixel-level annotations and provide high-performance and low-cost prescription for fine-grained interpretation of optical and SAR remote sensing images.关键词:remote sensing image;instance segmentation;fine-grained interpretation;weakly supervised learning;priori information;driven system;target contour;annotation cost496|1369|0更新时间:2026-01-05
 - “崎岖地形对光学遥感影像产生畸变,影响山区土地覆盖分类和生物理化参数反演精度。本文系统阐述了地形效应产生的机制,介绍了常用地形校正方法的基本原理,定量展示了光学遥感地形校正的发展历程和研究热点,为今后地形校正方法的优化提供了参考。”
 摘要:Rugged terrain distorts optical remote sensing observations and subsequently affects land cover classification and biophysical and biochemical parameter retrieval over mountainous areas. Therefore, topographic correction is a prerequisite for many remote sensing applications. Since the 1980s, domestic and foreign scholars have studied the accurate acquisition of remote sensing reflectance on mountainous areas and have established various topographic correction methods to mitigate the topographic effects on remote sensing images. Although comparative studies on topographic correction methods exist, most are limited to specific images and a few evaluation criteria, resulting in conclusions that are often insufficient and inconsistent. Currently, systematic reviews on topographic correction research are lacking, which limits a comprehensive understanding of the current research status. This review first systematically expounded the mechanism of topographic effects generated from the two key pathways by which terrain affects optical remote sensing imaging processes. Then, the principles of commonly used topographic correction methods were described. On the basis of literatures from Web of Science/Scopus and China National Knowledge Infrastructure between 1980-01 and 2022-08 related to topographic correction for optical remote sensing, various information was extracted from each literature and analyzed the volume of publications, the characteristic analysis of different parts (satellite sensors, digital elevation model, topographic correction methods, and evaluation criteria) of correction, and the performance analysis of topographic correction methods using the meta-analysis method. Finally, the key scientific issues of topographic correction are discussed, and the future main development directions are predicted. The quantitative results of this study demonstrate the development process and research hotspots of topographic correction for optical remote sensing, providing a reference for the selection and exploration of valuable new research directions for topographic correction methods in mountainous areas in the future.关键词:remote sensing;topographic correction;mountainous areas;Meta-analysis;image procession646|1037|0更新时间:2026-01-05
 - “最新研究突破遥感影像语义变化检测难题,有效关注变化区域,保持变化结果和语义结果一致性。”
 摘要:Semantic change detection of remote sensing images plays an important role in ecological environment, land use, and land cover monitoring. In recent years, deep learning-based change detection methods are the hotspot of remote sensing intelligent interpretation concern; however, the existing three-branch semantic change detection methods lack consistency of change branch and semantic branches, which leads to the self-contradiction of the bitemporal semantic change detection.To address this problem, this study proposes a remote sensing image semantic change detection algorithm based on Siamese CNN and Transformer. In the encoding stage, the Siamese ResNet34 network is first designed to extract the multiscale features of the image, and the difference enhancement module is embedded to increase the attention of the change information; then, the semantic tokenizer is used to map the feature map into compact semantic tokens, and the Transformer encoder is used to combine the bitemporal semantics and the change information to model the “semantic change” consistency. In the decoding stage, different fine-grained semantic information is fused by the Transformer decoder using a hopping connection to generate a refined semantic feature map. Finally, the result of bitemporal semantic change is obtained after upsampling recovery and mask multiplication.Experimental results on the remote sensing semantic change detection public dataset SECOND and Landsat-SCD show that the proposed algorithm can effectively focus on the change region, maintain the consistency between the change results and the semantic results, and achieve excellent evaluation indexes and visual effects.We can draw the following conclusions(1) The proposed difference enhancement module can enhance the difference characteristics of bitemporal remote sensing images and improve the network’s focus on change information. (2) The proposed bitemporal Transformer module maps the difference information and bitemporal semantic information into semantic tokens and fuses them to model jointly the “semantic change” information of the whole spatiotemporal domain in the token space, effectively modeling the long-range dependencies in the images and the bitemporal contextual correlations. The long-range dependency in the image is effectively modeled, and the bitemporal contextual relevance is modeled. The ReTNet network designed accordingly pays more attention to the change area and can accurately detect the change location and recognize the change element type of the bitemporal remote sensing image.关键词:remote sensing image;change detection;Semantic Consistency;Difference Enhancement;Multi-scale Features;Siamese network;ResNet34;Transformer1379|1601|0更新时间:2026-01-05
Models and Methods
- “在第二届全国海岸带大会暨智能海岸论坛上,500余名专家学者深入探讨智能海岸与区域高质量发展,为海岸带科学研究与工程应用发展提供新思路。”摘要:2024年9月27—29日,第二届全国海岸带大会暨智能海岸论坛在北京国家会议中心顺利召开。500余名专家学者围绕会议主题“智能海岸与区域高质量发展”进行深入交流,探讨海岸带科学研究与工程应用的长足发展。本文对大会成果进行综述与思考。首先介绍了会议概况,包括组织情况、参与情况和主题议程等。然后从海岸带数字技术与智能应用等6个方面详细阐述专家观点,重点介绍新方法和前沿方向。最后,总结当前成果存在的技术、跨学科与协同等层面的问题与挑战,指出大数据、数字孪生和人工智能将进一步深度融合,为海岸带研究提供重要支撑。关键词:海岸带;新质生产力;高质量发展;生态环境;大数据;人工智能;专家观点213|658|0更新时间:2026-01-05
Short Communications
- Postal code:100190
- Tel:010-58887052 Email:nrsb@aircas.ac.cn
- Technical support is provided by Beijing Founder electronics co., LTD 京ICP备20021838号-9
 京公网安备11010802024621
 - It is recommended to read the content of this site in Chrome&IE9+. Please switch to extreme mode in browser 360.
- Cookies We use cookies to help provide and enhance our service and tailor content. By continuing, you agree to the use of cookies.

0