
最新刊期
卷 29 , 期 5 , 2025
- “在高标准农田建设领域,专家构建了遥感监测框架,为提升监测监管能力提供参考。”
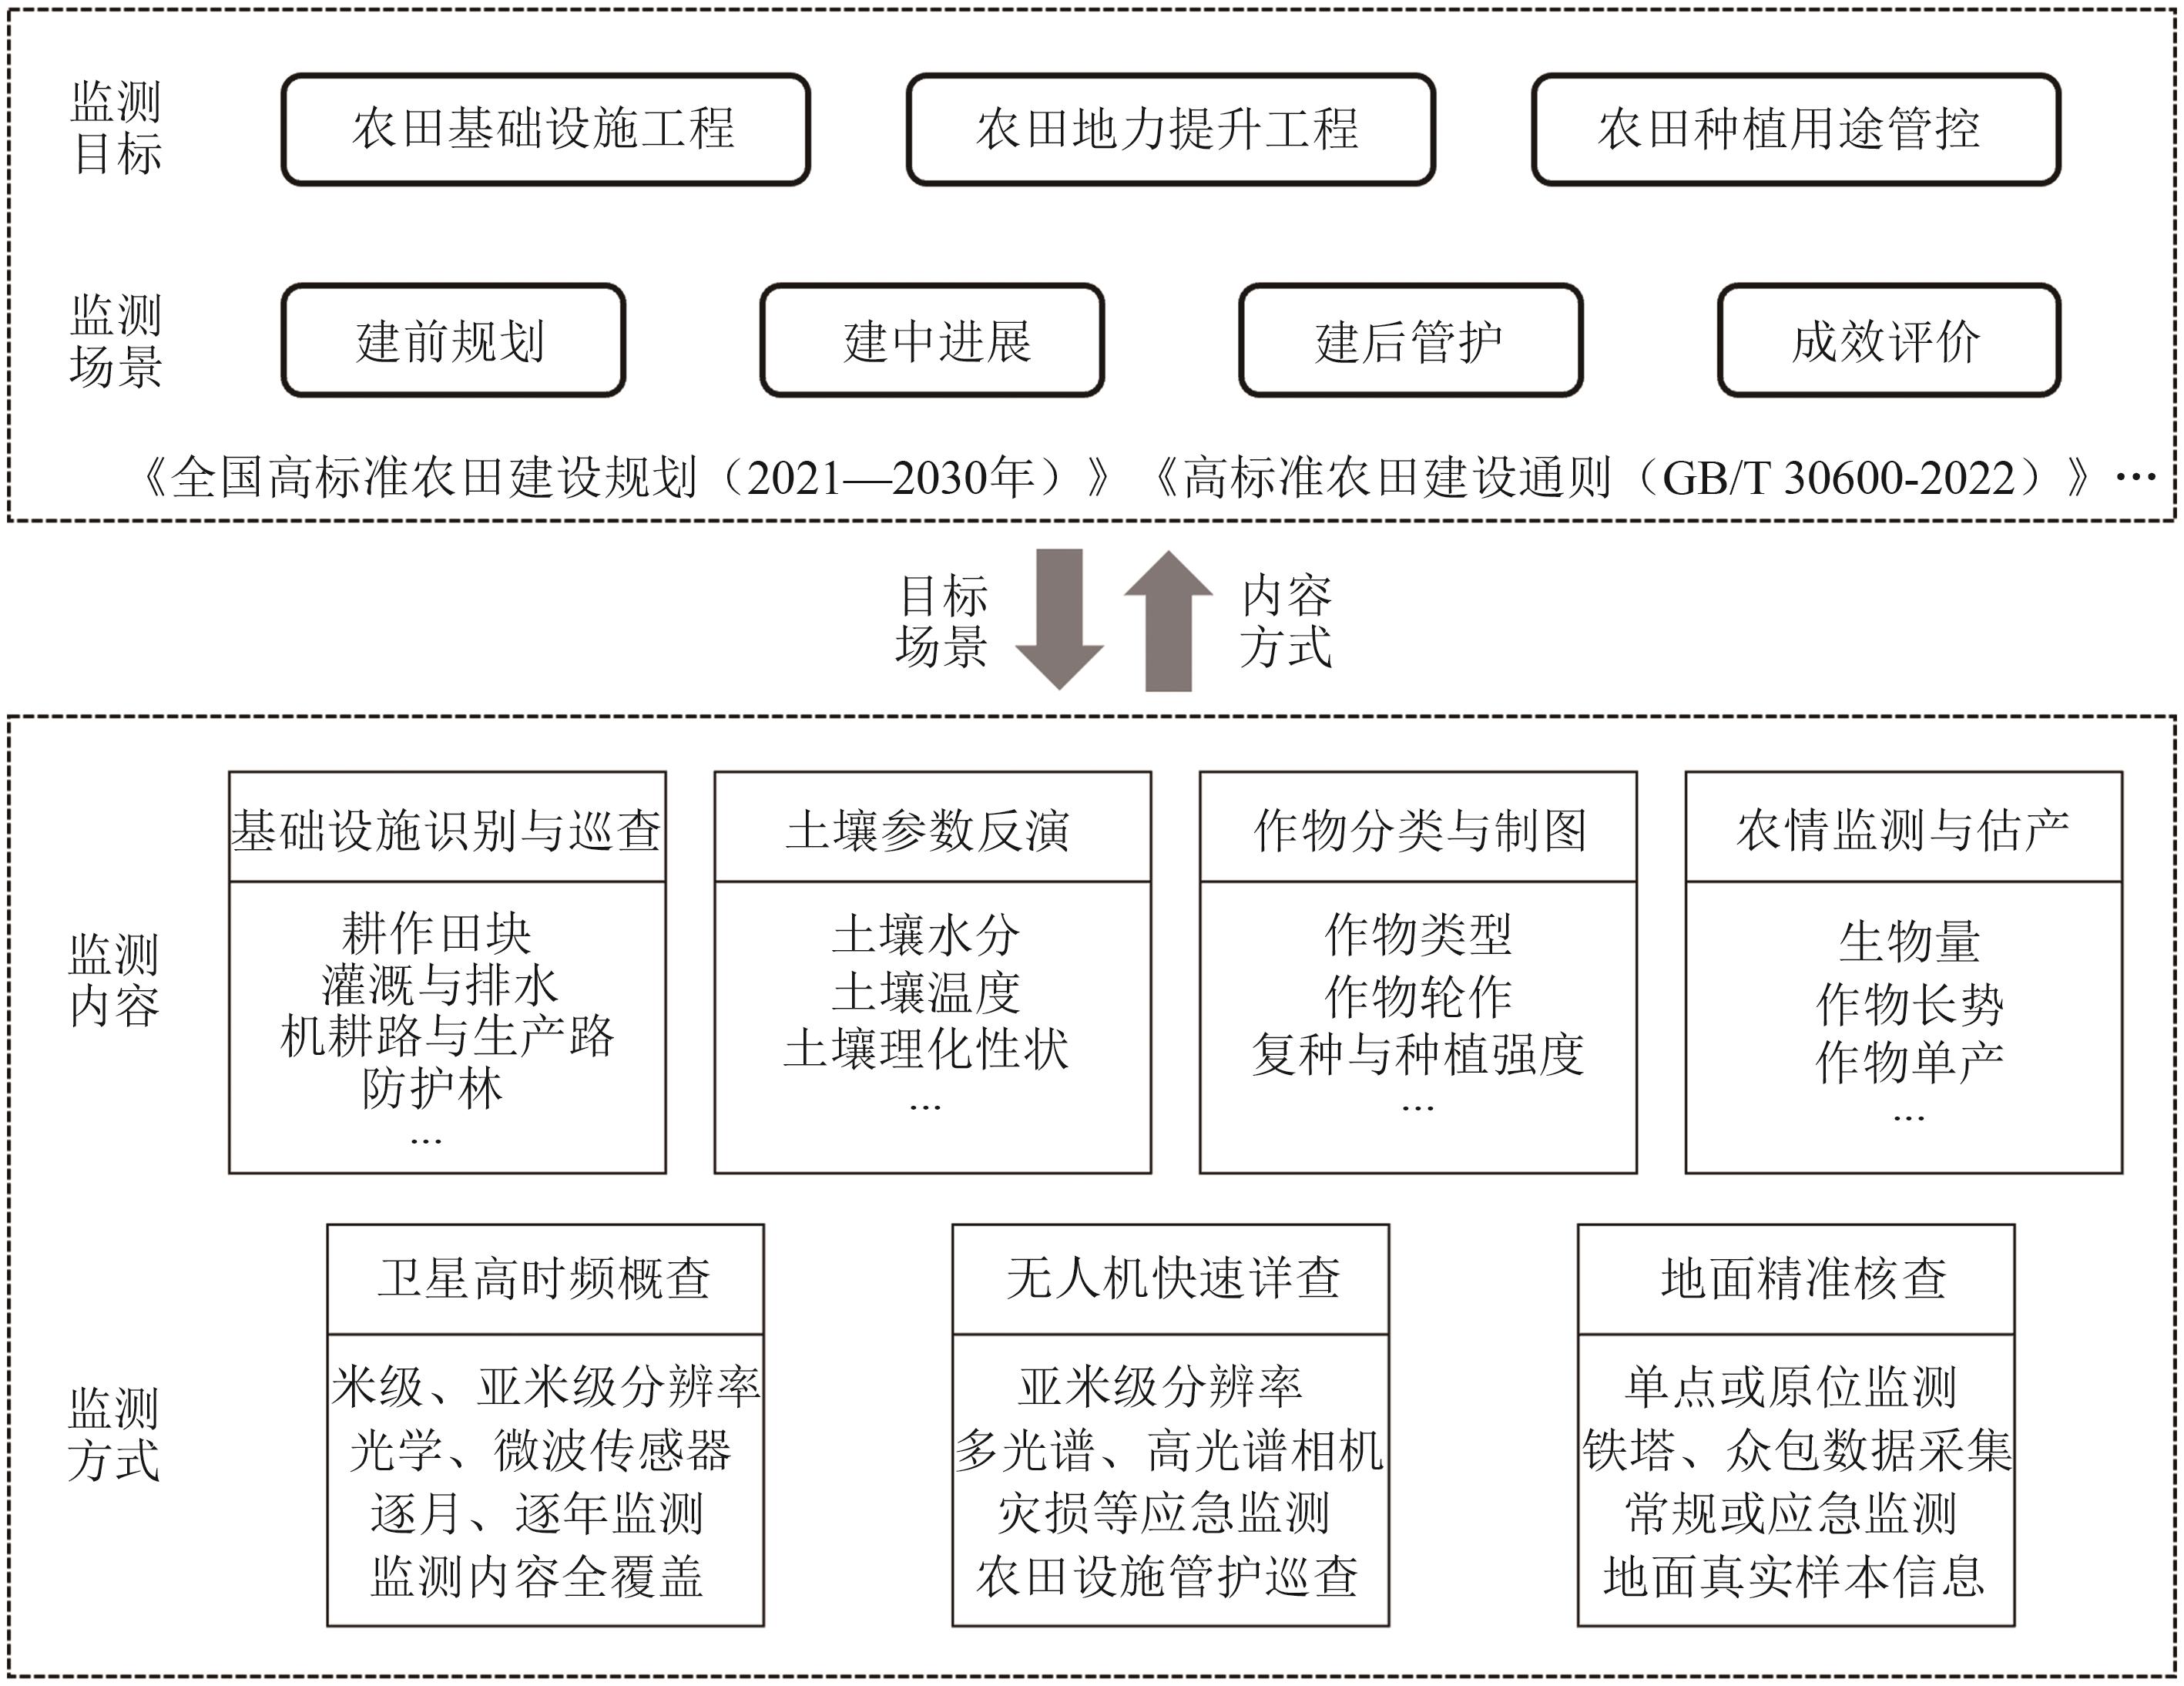 摘要:The construction of well-facilitated farmland is a crucial strategy for consolidating and improving grain production capacity and ensuring national food security. At present, the management of well-facilitated farmland construction mainly relies on traditional methods. The robust advancement of remote sensing and other new-generation information technologies has established favorable conditions for information-based monitoring and supervision. We conducted a comprehensive review on the current advances of remote sensing monitoring technology and analyzed the potential for developing a remote sensing-based well-facilitated farmland monitoring system. Although scholars in domestic and foreign countries have carried out extensive research on remote sensing for ground feature identification, land use classification, and parameter inversion, studies that focused on monitoring targets of well-facilitated farmland are lacking. The existing remote sensing technology methods are insufficient for the thorough monitoring and supervision of well-facilitated farmland. On the basis of the policy goal of optimizing farmland management, this review summarizes the relevant research progress in agricultural remote sensing and evaluates the applicability of existing technical tools in the remote sensing monitoring of well-facilitated farmland. The technical framework of remote sensing monitoring for well-facilitated farmland is proposed, including infrastructure projects, farmland quality improvement projects, planting use management, and grain production. Through a review of technical needs, a remote sensing monitoring framework for well-facilitated farmland construction was established, which clarified monitoring elements, indicator accuracy requirements, and monitoring frequency. Remote sensing monitoring methods for indicators such as field parcel, roads, and protective forests, soil fertility indicators (such as pH, salt content, and organic matter), and farmland utilization indicators (such as crop planting structure) are relatively mature. However, the monitoring indicators for grain production capacity still need to be improved. This study provides a reference for guiding the implementation of accurate, intelligent, and dynamic remote sensing monitoring of well-facilitated farmland, forming a relevant technical standard system and application standard model.关键词:agricultural remote sensing;well-facilitated farmland;ground feature recognition;soil parameters;crop classification;grain production capacity;remote sensing retrieval;monitoring indicators516|422|0更新时间:2025-07-01
 - “无人机技术在互花米草监测治理领域取得新进展,为滨海湿地生态保护提供新方法。”
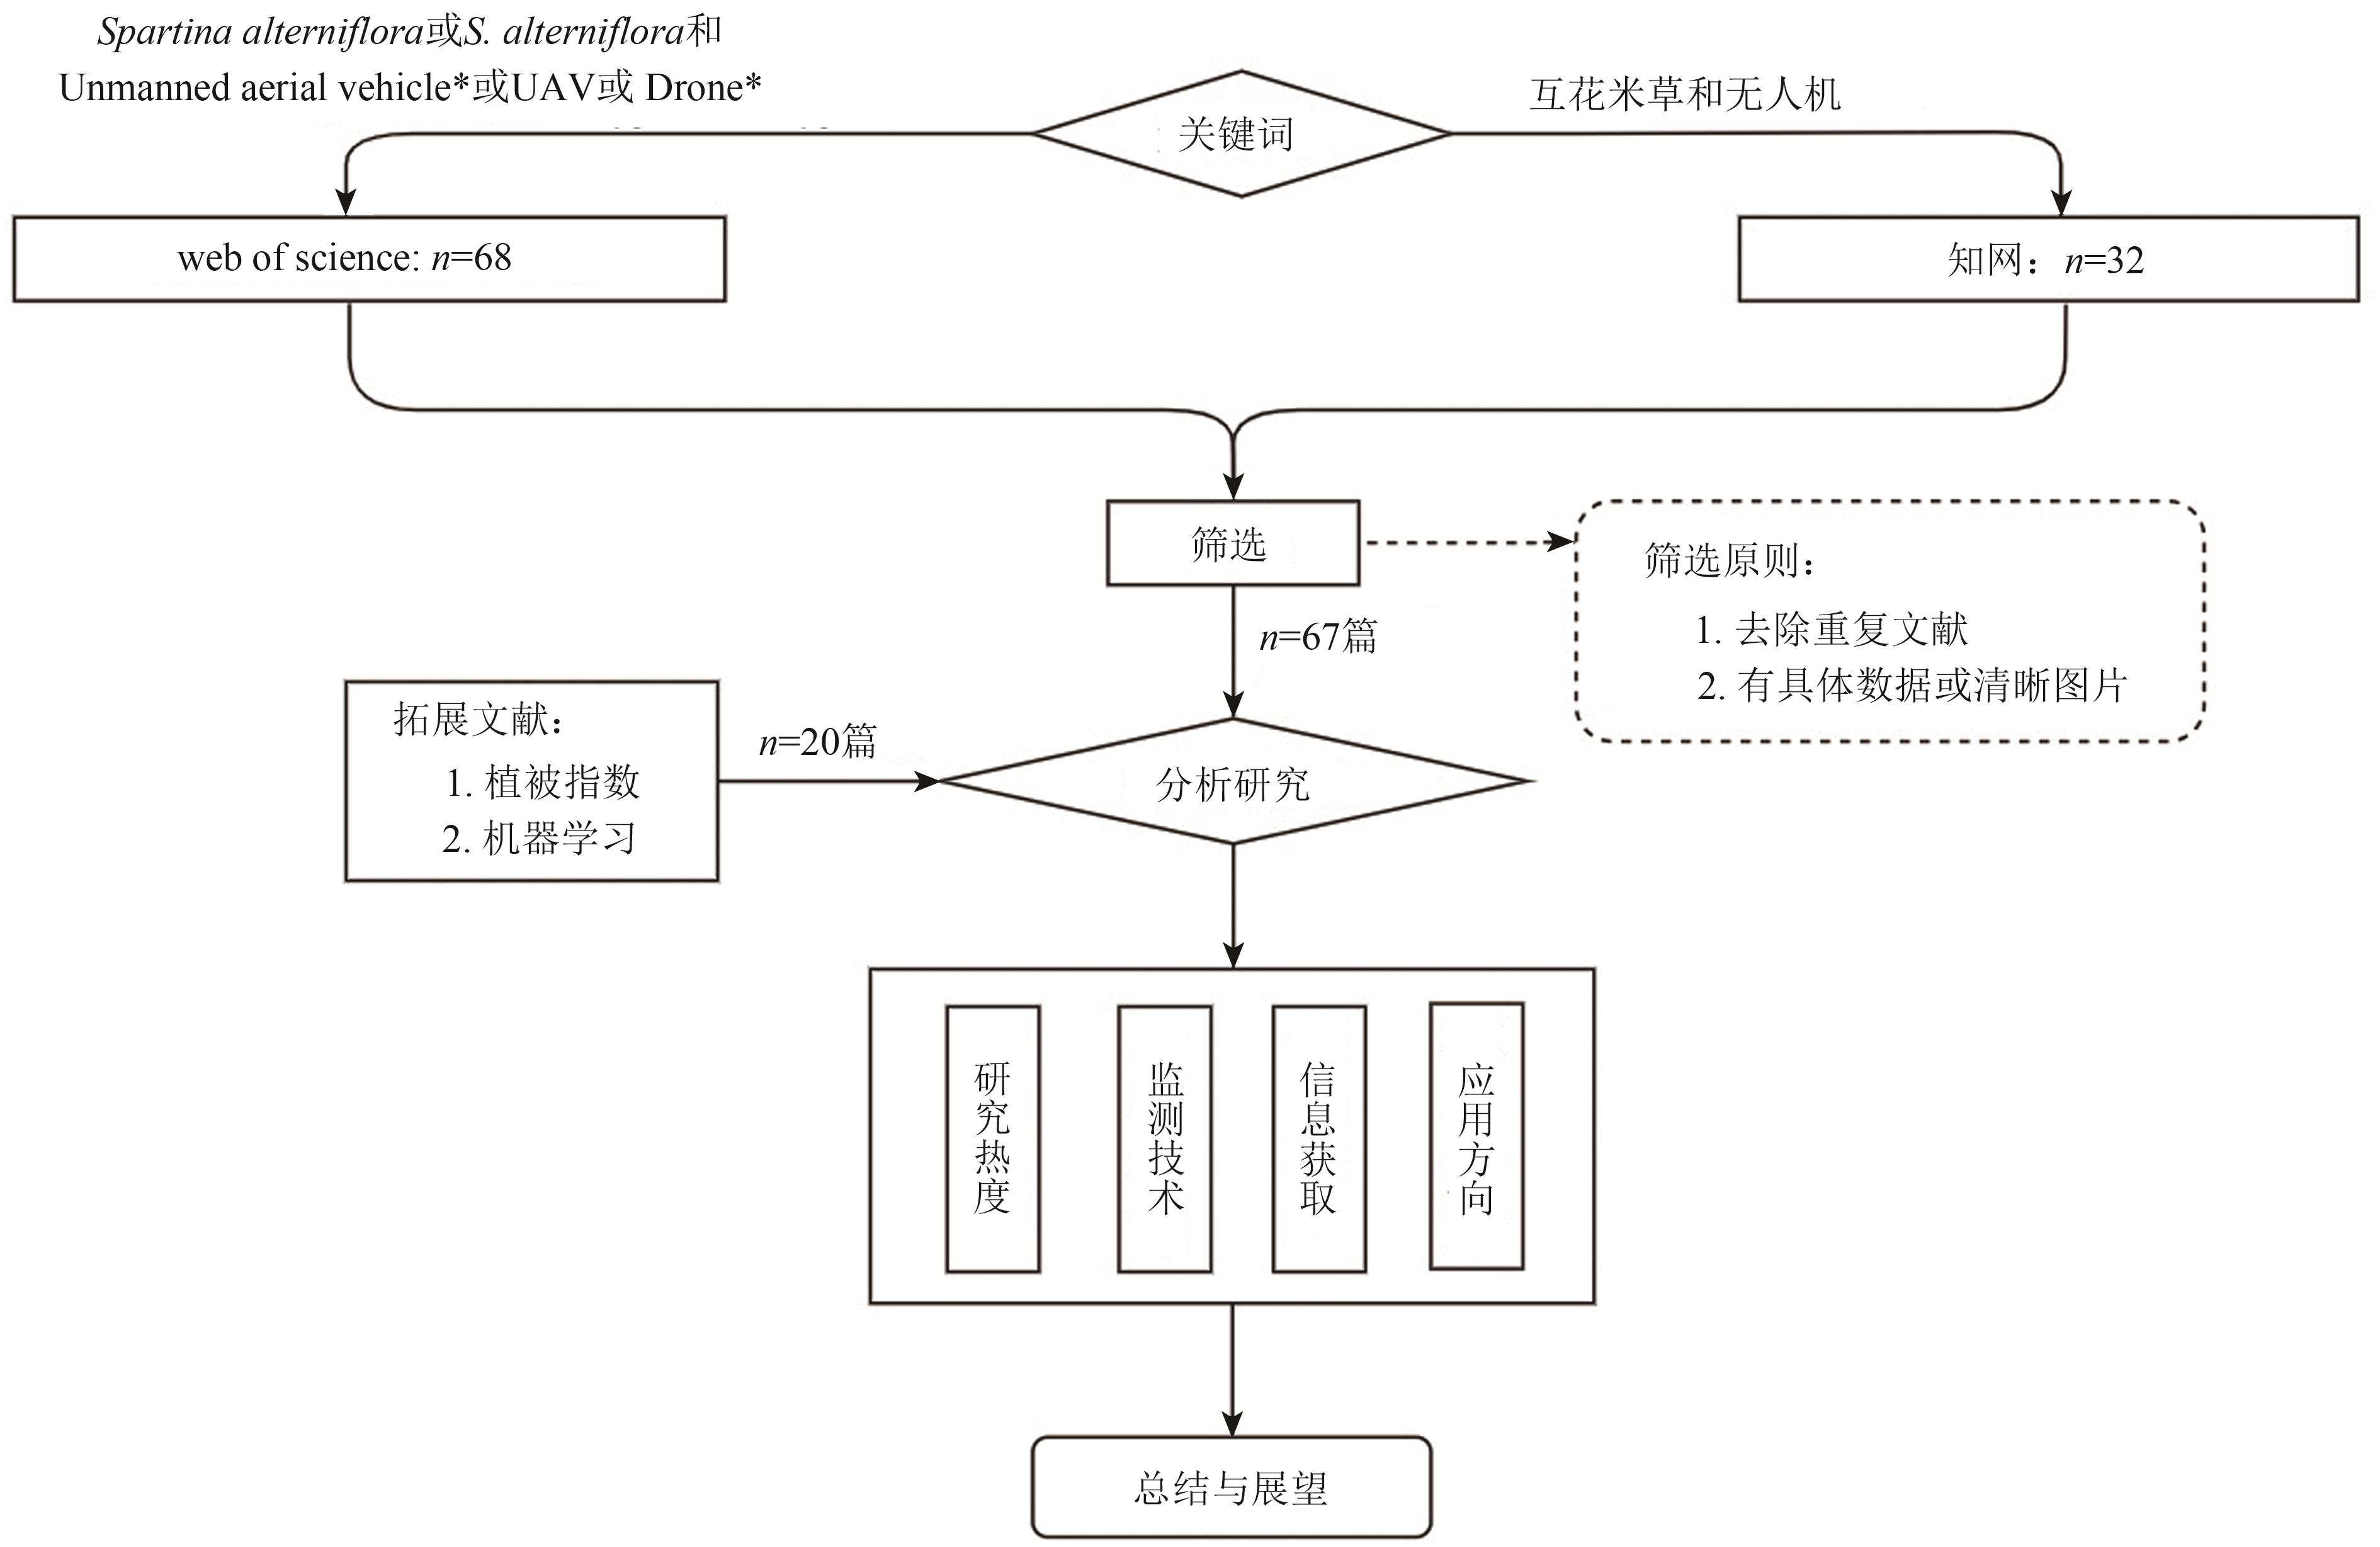 摘要:Spartina alterniflora, commonly known as smooth cordgrass, is a dominant invasive species in coastal wetlands worldwide, posing significant ecological threats to native ecosystems. The emergence of Unmanned Aerial Vehicle (UAV) technology has provided innovative tools for monitoring and managing S. alterniflora. This review aims to synthesize existing research on the application of UAVs in studying S. alterniflora, focusing on research trends, monitoring techniques, data acquisition methods, and practical applications. Additionally, it identifies challenges and proposes future directions to optimize UAV-based methods for addressing the complexities of invasive species management.This review systematically examined academic literature on the integration of UAV technology into S. alterniflora research. UAVs equipped with high-resolution optical cameras, multispectral sensors, and LiDAR systems have been deployed for diverse purposes, including mapping the spatial and temporal distribution of S. alterniflora, identifying invasive patches, and assessing ecological impacts. Analytical methods such as vegetation indices (e.g., NDVI and SAVI) and advanced machine learning algorithms (e.g., random forests and neural networks) were reviewed for their effectiveness in extracting and analyzing UAV-acquired data. The review also highlighted experimental setups, UAV configurations, and environmental considerations to enhance monitoring precision.UAVs have demonstrated substantial advantages over satellite-based remote sensing for S. alterniflora studies, primarily due to their superior spatial resolution, operational flexibility, and ability to avoid cloud interference. Key findings include: (1) Spatiotemporal distribution: UAV imagery enables fine-scale mapping of S. alterniflora expansion, revealing patterns influenced by seasonal changes, hydrodynamic conditions, and anthropogenic activities. Studies showed a marked seasonal growth rate, with rapid expansion observed during summer and autumn. (2) Patch dynamics: High-resolution UAV imagery allows precise identification and quantification of S. alterniflora patches, facilitating insights into invasion stages, from establishment to explosive growth. Patch size distribution analysis indicates a self-organized pattern, supporting targeted management strategies. (3) Response to extreme events: UAVs have been effectively employed to assess the impact of typhoons and other extreme weather events on S. alterniflora, identifying vegetation loss and sediment redistribution. These studies underscore the resilience and adaptability of the species under varying environmental stressors. (4) Ecological impacts: UAVs provide detailed observations of S. alterniflora’s interactions with native flora and fauna, such as mangroves and aquatic organisms. These findings are critical for evaluating the broad ecological consequences of its invasion. (5) Management applications: UAVs have been utilized for herbicide application, with promising results in reducing S. alterniflora coverage while minimizing ecological risks. Future research may enhance UAV adaptability for large-scale and long-term management efforts.UAV technology has proven to be an indispensable tool for advancing research and management of S. alterniflora in coastal wetlands. However, challenges remain, including limited datasets for large-scale analyses, the need for standardized UAV protocols, and the adaptation of UAV systems to complex environmental conditions. Future research should focus on the following areas: (1) expand UAV studies to diverse regions and compiling long-term high-resolution datasets; (2) develop new vegetation indices and parameter models tailored to S. alterniflora’s unique spectral characteristics; (3) enhance UAV hardware and software capabilities to improve performance under extreme environmental conditions; (4) promote interdisciplinary collaboration and data sharing to foster a comprehensive understanding of S. alterniflora’s ecological and management dynamics globally. The continued innovation and application of UAV technology will be pivotal in mitigating the ecological impacts of S. alterniflora and safeguarding the integrity of coastal ecosystems.关键词:spartina alterniflora;Unmanned Aerial Vehicle (UAV);coastal wetlands;remote sensing;alien invasions;ecological and environmental effects;control methods;patches;monitoring techniques253|348|0更新时间:2025-07-01
 - “在遥感领域,关联数据集研究起步较晚,本文全面调研了视觉和遥感领域的关联数据集,为后续研究提供参考。”
 摘要:Target relationship analysis aims to gain a deep understanding of the target based on the detection task. In recent years, target relationship analysis based on computer vision has attracted the attention of researchers in related fields, whereas the relationship analysis algorithm in remote sensing emerged later. A primary concern is the lack of relationship datasets for the remote sensing field. Therefore, this article aims to fill the gap in the review of association datasets, conduct a detailed review and analysis of relationship datasets and target relationship analysis algorithms in the fields of computer vision and remote sensing, and provide new ideas for the research and development of target relationship analysis in the remote sensing field.In terms of relationship datasets, this article reviews and outlines 15 published image and video visual association datasets and four remote sensing image association datasets in the fields of computer vision and remote sensing. It systematically introduces their characteristics, data scale, association categories, and number of triples, as well as summarizes the limitations of existing remote sensing relationship datasets such as inconsistent annotation formats and obvious long-tailed small groups. In terms of target relationship analysis algorithms, this article divides the existing algorithms into relationship analysis algorithms based on conditional random fields and relationship analysis algorithms based on deep learning. Moreover, it summarizes the advantages and disadvantages of each type of algorithm and compares the performance of the most advanced algorithms based on the evaluation metric commonly used in target relationship analysis tasks. Finally, the factors that improve the performance of current remote sensing target relationship analysis algorithms are summarized, such as complex semantic relationships and dynamic time-varying scenes.In view of the limitations of current relationship datasets and target relationship analysis algorithms, this article proposes possible future research directions. Regarding association datasets, this article proposes a concept of building a remote sensing relationship dataset for time-series data and annotation specifications for remote sensing target relationships. Moreover, it preliminarily develops a set of association annotation tools for remote sensing images, which provides optimization suggestions for the construction direction of future relationship datasets. Regarding target relationship analysis algorithms, this article proposes innovative methods such as association dynamic hierarchical modeling and dynamic scene graphs, to provide ideas for researchers in related fields.Target relationship analysis is an important step to move from target perception to cognition. However, research on target relationship analysis in the field of remote sensing is still in its infancy, and there is a lack of discussion of remote sensing target relationship datasets. To address this problem, this article systematically organizes the existing relationship datasets in the current computer vision and remote sensing fields and summarizes the limitations of remote sensing relationship datasets. This article also summarizes the research status of target association algorithms and demonstrates the advantages and disadvantages of existing algorithms according to the algorithm type. Finally, this article proposes a series of possible research ideas for the development of target relationship analysis in the field of remote sensing. In terms of sample accumulation, this article proposes the idea of constructing a remote sensing time-series relationship dataset. To unify the annotation format, a set of sample annotation and visualization tools is developed. In terms of algorithm innovation, this article proposes the idea of a dynamic hierarchical relationship reasoning method, which provides new ideas for the future development of target relationship analysis algorithms.关键词:remote sensing;Target relationship analysis;Relationship datasets;Scene graph generation;review;dataset171|323|0更新时间:2025-07-01
 - “全球卫星遥感技术不断创新,海量数据蕴藏巨大潜力。分析即用数据ARD大幅降低数据处理成本,推动数据共享与科学发现。国产高分卫星数据的GF ARD产品,为对地观测大数据高质量、高效率、标准化应用提供思路。”
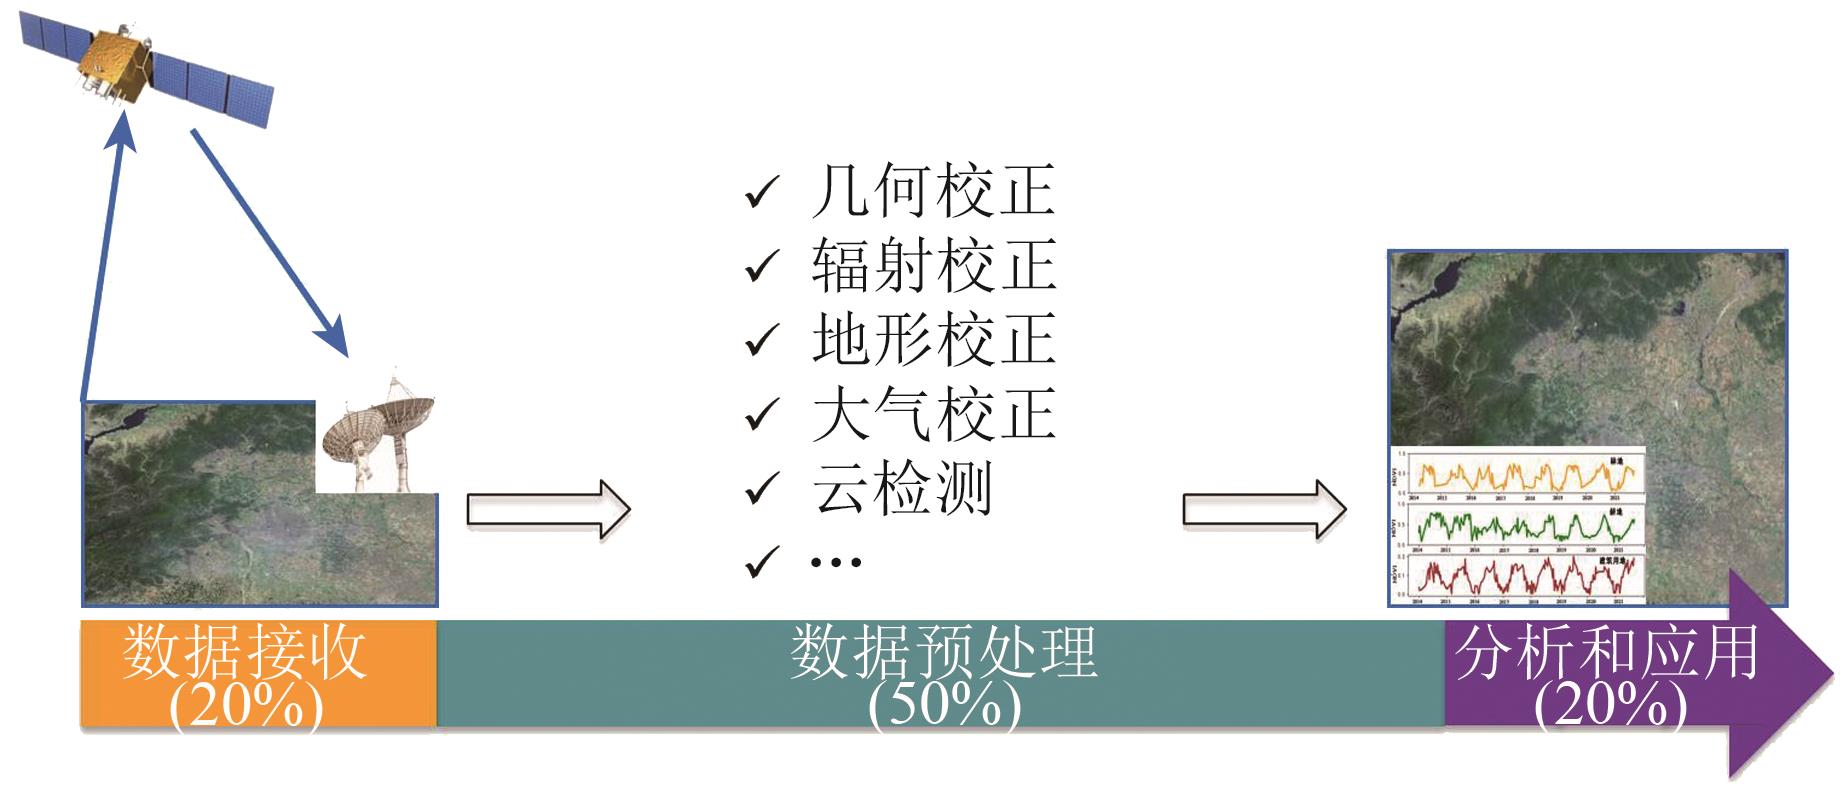 摘要:With the development of a new generation of remote sensing satellites such as high resolution and super-resolution satellites, the earth observation data have experienced explosive growth. The massive historical observation data and the new-generation earth observation data provide opportunities for systematically monitoring and evaluating the changes on the earth’s surface, enabling researchers to study the dynamic trends of earth science, environmental science, resource science, and global change at a macroscopic scale. The high difficulty, low efficiency, and high cost of data preprocessing are important reasons for the insufficient supply of earth observation data. First, the raw data of remote sensing satellites usually need complex preprocessing before analysis and applications, including radiometric calibration, atmospheric correction, and terrain effect correction. Second, many satellite users lack professional knowledge, infrastructure, and bandwidth, hindering efficient data utilization. In addition, users in different fields must repeatedly perform similar preprocessing operations to meet diverse application requirements, resulting in unnecessary labor costs. In response to these challenges, the “Analysis Ready Data” (ARD) concept was proposed by Committee on Earth Observation Satellites, providing detailed processing and quality control requirements to ensure that the data can be directly used for analysis and applications. Many countries and institutions have successively developed ARD compliant products, such as the Landsat ARD in the United States and the Sentinel-2 ARD in Europe. The development of ARD in China started relatively late, but breakthroughs have been achieved in recent years, and the GF ARD product with high spatiotemporal resolution and good consistency has been launched. The popularization of ARD has accelerated data sharing and scientific research, promoted the openness and cooperation of global remote sensing big data, and enabled long-term sequence analysis and global monitoring. This paper examines the background, connotation, and development status of ARD; introduces the international mainstream optical satellite ARD products; discusses the remote sensing cloud platforms and data cubes that serve as the carriers for ARD production and sharing; summarizes the problems and challenges faced in the production of domestic optical satellite data ARD products; and focuses on introducing the first set of domestic high-resolution satellite data ARD: the GF ARD product. It also discusses the key issues that ARD needs to solve in the future, aiming to provide ideas for the high-quality, high-efficiency, and standardized application of earth observation big data, thereby facilitating major scientific discoveries and government decision-making.关键词:earth observation;Analysia Ready Data;Chinese satellites;normalization processing;cloud platform;data cube;data mining;multi-source data327|161|0更新时间:2025-07-01
Research Progress

- “在作物需水规律研究领域,专家基于遥感数据,分析了中国三大粮食作物的蒸散发耗水特征,为制定精准灌溉方案提供科学依据。”
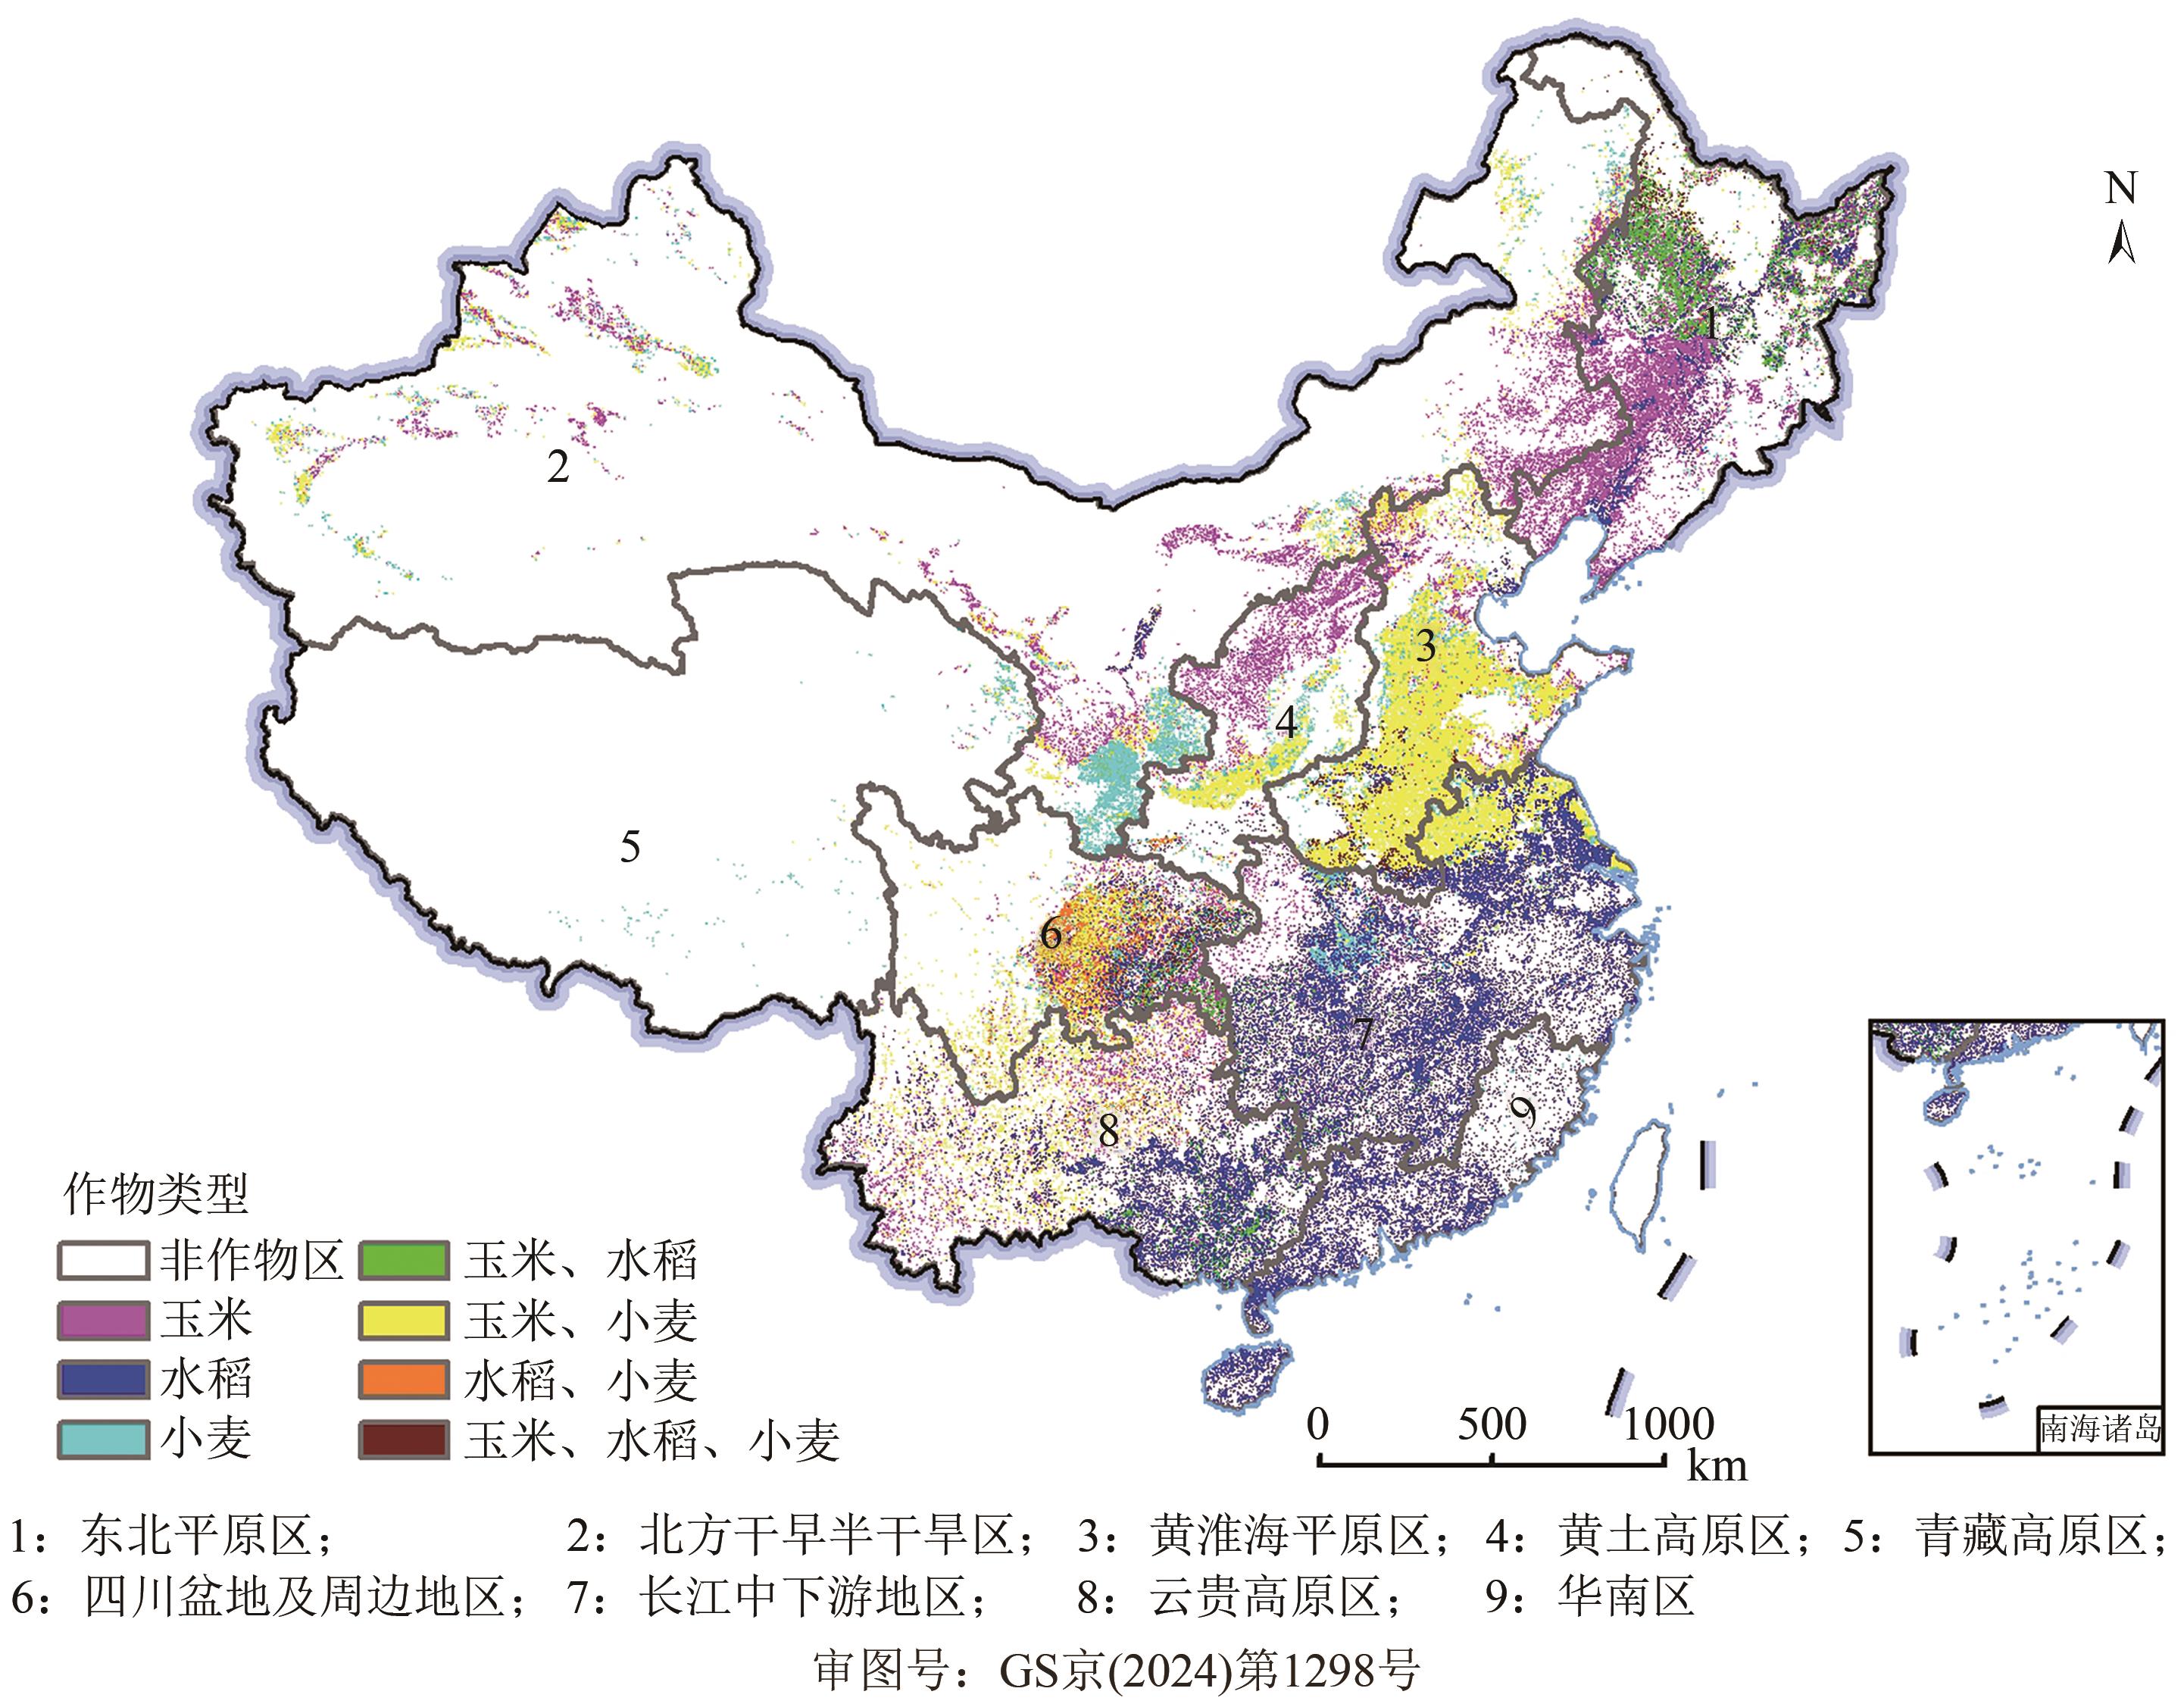 摘要:Understanding the water requirements of crops at different growth stages and spatial-temporal scales is crucial for developing efficient irrigation strategies and improving water resource utilization. Evapotranspiration is the primary method of crop water consumption. This study combined regional-scale multi-temporal cumulative statistical method with high-resolution remote sensing data on evapotranspiration and crop phenology to analyze the evapotranspiration water consumption characteristics of three staple crops (maize, rice, and wheat) in nine agricultural regions of China. The analysis focused on different time scales, including the yearly scale, growth seasons, phenological dates, and changes from 2001 to 2019. The findings revealed that the yearly evapotranspiration water consumption in the planting regions of the three crops gradually decreased from south to north. Irrigation significantly increased surface evapotranspiration, and evapotranspiration exceeded precipitation in arid and semi-arid areas, such as the Huang-Huai-Hai Plain and the Loess Plateau. From 2001 to 2019, yearly evapotranspiration water consumption in most crop planting areas experienced an increasing trend, with a significantly higher increasing rate in the north compared with the south. The spatial and temporal variability of evapotranspiration water consumption was more pronounced in winter than in summer. Maize and rice exhibited higher evapotranspiration water consumption during the growing season than wheat. Single rice exhibited higher evapotranspiration compared to early and late rice, while spring wheat had higher evapotranspiration than winter wheat. The increase rate in evapotranspiration water consumption during the growing seasons of maize was more pronounced than that of wheat and rice. The proportion of evapotranspiration water consumption during a single growing season to the whole year was greater in the north than in the south. Daily evapotranspiration water consumption among the three staple crops showed significant differences at key phonological dates. Maize consumed more water during the heading stage than at the V3 and maturity stages. We observed similar daily water consumption at the heading and maturity stages for wheat, higher than that at the green-up or emergence stages. Daily evapotranspiration water consumption of early rice increased gradually at the transplanting, heading, and maturity stages, but the opposite trend was observed for late rice. Single rice had the highest daily evapotranspiration at the heading stage, followed by the transplanting stage. Despite the inherent uncertainties associated with remote sensing-based evapotranspiration and phenology, the advantages of remote sensing in monitoring evapotranspiration water consumption over large areas are noteworthy. This information on crop water consumption can provide a scientific foundation for devising irrigation strategies and planting systems.关键词:remote sensing;evapotranspiration water consumption;three staple crops;key phonological dates;Spatial and temporal variability1235|2165|0更新时间:2025-07-01
 - “最新研究进展显示,专家提出了基于SSAFormer的红树林群落精细分类模型,有效提升了分类精度。”
 摘要:Mangroves are one of the most biodiverse and productive marine ecosystems, and the fine classification of mangrove communities by combining high-resolution remote sensing images and deep learning has become a hot and difficult topic in current research. In this paper, we proposed a novel deep learning classification network model SSAFormer (Swin-Segmentation-Atrous-Transformer) for fine classification of mangrove communities. The SSAFormer used Swin Transformer, a variant of Visual Transformer, as the backbone network. The Atrous Spatial Pyramid Pooling (ASPP) in the Convolutional Neural Network (CNN) architecture was added to the backbone network to extract additional scale feature information. The Feature Pyramid Network (FPN) structure was embedded in the light-weight decoder to fuse the rich semantic feature information of the low and high layers. In this paper, three active and passive feature datasets were constructed based on GF-7 multispectral image and UAV-LiDAR point clouds, and the classification results of the improved Swin Transformer and SegFormer algorithms were compared and analyzed to further demonstrate the classification performance of the SSAFormer algorithm for mangrove communities. Results of the study revealed the followings. (1) Compared with the improved Swin Transformer and SegFormer algorithms, SSAFormer achieved a fine classification of mangroves, with an overall accuracy (OA) increase of 1.77%—5.3%, Kappa up to 0.8952, and a mean intersection over union (MIoU) was improved by 7.68%. (2) On the GF-7 multispectral dataset, the SSAFormer algorithm achieved the highest OA of 91%, and MIoU of the SSAFormer algorithm on the UAV-LiDAR dataset improved to 57.68% on the UAV-LiDAR dataset with the inclusion of spectral features. The mean value of the SSAFormer algorithm MIoU improved by 1.48%. (3) The UAV-LiDAR showed a maximum improvement of 5.35% in MIoU compared with the GF-7 multispectral data, a mean improvement of 1.81% in OA, and an improvement of 2.6% in the classification accuracy (F1-score) of the UAV-LiDAR with the inclusion of spectral features. (4) With the SSAFormer algorithm, the highest classification accuracy (F1-score) of 97.07% was achieved for Avicennia marina, the classification accuracy (F1-score) of Aegiceras corniculatum achieved 91.99%, the classification accuracy (F1-score) of Sporobolus alterniflorus reached 93.64%, and the average value of classification accuracy (F1-score) of A. corniculatum reached the highest 86.91% on the SSAFormer model. The above conclusions proved that the proposed model can effectively improve the classification accuracy of mangrove communities.关键词:remote sensing;mangrove;GF-7 multispectral;UAV-LiDAR point clouds;SSAFormer;deep learning;Active and passive image combination;feature selection;Fine classification of community687|535|0更新时间:2025-07-01
 - “高光谱技术在薄壳山核桃养分估测中取得新进展,通过分数阶微分和两波段光谱指数显著提高叶片氮素含量估算精度。”
 摘要:Leaf nitrogen content can indicate the nutritional status and growth of plants. Hyperspectral technology can be used to estimate plant physiological and biochemical indicators in a non-destructive and efficient manner, providing reliable data for assessing the nutrient and health status of plants during growth and development. In order to explore the potential of hyperspectral technology in estimating the nutrient content of Carya illinoensis, this study took Carya illinoensis (Changlin and Jiande series) as the research object. Canopy hyperspectral data of 53 Carya illinoensis were randomly collected from 350—2500 nm in the field. Fractional Order Derivative (FOD) was used to preprocess the canopy spectrum, then two types of two-band spectral indices were combined to investigate the response relationship between Leaf Nitrogen Content (LNC) and canopy spectrum of Carya illinoensis. Finally, the modeling variables were screened by Variable Combination Population Analysis (VCPA). eXtreme Gradient Boosting (XGBoost) estimation models of canopy FOD single-band and FOD combined two-band spectral indices were constructed respectively, so as to obtain a suitable LNC estimation model under the test conditions of this experiment. Results showed that compared with the raw spectrum, the correlation between the canopy spectrum after FOD pretreatment and the LNC of Carya illinoensis was enhanced by 0.152. In terms of improving the correlation between spectral features and target components, FOD combined with Normalized Difference Spectral Index (NDSI) and Difference Spectral Index (DSI), had better performance than that of single band, with an improvement of 0.250 and 0.277, respectively. The VCPA variable selection method ultimately screened a subset of spectral variable combinations containing both strong and weak information variables, playing an important role in improving the estimation model accuracy. The optimal Carya illinoensis LNC model is the 1.5th-order derivative transformation combined with DSI, with R
Forestry and Agriculture
- “InSAR技术在地学参数反演、基础设施监测等领域广泛应用。研究揭示了非零闭合相位对形变测量结果的影响规律,为常规SBAS方法的基线选择和相位偏差改正提供技术参考。”
 摘要:Time-series Interferometric Synthetic Aperture Radar (InSAR), as an advanced radar remote sensing technique, achieves high-precision measurements of subtle surface deformations. It is widely applied in fields of geological parameter inversion and infrastructure monitoring. The recent emergence of Nonzero Closure Phase (NCP), also referred to as phase bias, challenges the conventional assumption of InSAR phase consistencies, disrupting the phase consistency assumption in InSAR data processing and leading to systematic biases in deformation results, particularly in SBAS-InSAR (Small Baseline Subset InSAR). This study aims to analyze the mechanisms and sources of NCP from a mathematical and physical perspective, analyze the relationship between phase bias and land cover types under different multi-look ratios, and explore its impact on conventional SBAS-InSAR methods with various time baseline combinations and numbers of interferograms.The study first systematically explains the mechanisms and sources of NCP to clarify potential error sources in InSAR. The relationship between phase bias and different land cover types under varying multi-look ratios is analyzed based on existing research. Finally, the study investigates the impact of NCP on conventional SBAS deformation measurements. Specifically, the deformation results are analyzed under short- and long-term baseline combinations to determine the impact of phase bias, and the effect of introducing additional interferograms is evaluated.The study finds that phase bias varies across different land cover types. Vegetation-covered areas are more susceptible to phase bias than built-up areas. Apart from special multi-look ratio scenarios such as 1∶1, there is no significant difference in phase bias across different multi-look ratios. Deformation results show considerable variance under different time baseline combinations, with short-term baseline combinations exhibiting greater deformation bias than long-term baseline combinations. Introducing long-term baseline interferograms effectively mitigates the impact of phase bias, while increasing the number of short-term baseline interferograms does not significantly affect the results. Overall, increasing the average time baseline helps reduce phase bias until the effect stabilizes.This study provides detailed technical insights into the selection of baselines and correction of phase deviation for conventional SBAS methods. It highlights the varying impacts of phase bias on different land cover types and the effectiveness of using long-term baseline interferograms to mitigate phase bias effects. These findings serve as a valuable reference for improving the accuracy of deformation measurements in InSAR applications.关键词:radar remote sensing;InSAR;NCP;phase bias;multi-looking;baseline combination;temporal baseline;SBAS658|860|0更新时间:2025-07-01
 -
SWSACNet: A change detection network for collapsed buildings extraction using multi-source images AI导读
“在遥感影像领域,专家提出了SWSACNet模型,有效识别倒塌建筑物变化,为灾害监测提供新方案。” 摘要:Objective Change detection networks based on deep learning are widely used in water monitoring and urban transformation. However, collapsed buildings, as a change objective, are rarely targeted for change detection networks. This study proposes an end-to-end collapsed building extraction model based on a change detection network including sliding-window feature enhancement and convolution attention mix mechanism, which is called Sliding-Window-Shift Attention Convolution mix Network (SWSACNet).MethodSWSACNet is an improvement of the Fully Transformer Network (FTN). FTN is a network completely composed of Swin Transformer. It has a unique frame, which involves four parts: Siamese Feature Extraction (SFE), Deep Feature Enhancement (DFE), Progressive Change Prediction (PCP), and Deep Supervision (DS). By encoding and decoding the feature of change objects, FTN can discern the modifications in collapsed buildings across two temporal images and suppress irrelevant information. ACmix, a blend of convolution and attention mechanism, has demonstrated better performance than Swin Transformer in mainstream datasets. As a result of different sensors and platforms, the spatial heterogeneity of target features in different source remote sensing images will affect the accuracy of change detection. Concerning this problem, we designed a similarity sliding window to match the feature maps of two temporal images. Thus, we replace Swin Transformer with ACmix to extract and restore earthquake-damaged features efficiently in the phase of SFE and PCP. We then use the similarity sliding window to reduce misidentifications of collapsed buildings in different source image pairs before the phase of DFE. Result Taking the earthquake with 7.8 magnitude that occurred on February 6, 2023, in Turkey as an example, we established a building seismic damage change detection dataset, which consisted of pre-earthquake Gaofen-2, Google images, and post-earthquake Beijing-3 images, and collapsed buildings were extracted based on the SWSACNet, FTN, STANet based on the Siamese self-attention mechanism, DASNet based on a dual-attention fully-convolutional neural network, and the conventional fully-convolutional early fusion FC-EF network. The experimental results showed that SWSACNet achieved the highest accuracy with F1 score of 80.8% and mIoU of 67.8%. The ablation experiments of the improved model indicated that SWSACNet obtained the highest precision among three structural combinations. By smoothing the BJ-3 image with high spatial resolution to align the gradient change rates of image pairs, we generated a new dataset and used it to retrain the five models. We found that the precision of the five retrained models increased by at least 1%, illustrating that appropriately narrowing the gap of gradient change rate of image pairs is an effective preprocessing technique for models to recognize collapsed buildings. Finally, by applying SWSACNet to three different data combinations covering Fevaipasa, Nurdagi, and Islahiye area, the results showed that it achieved an average F1 score of 60.84%. Conclusion The application of SWSACNet indicated that the model needs rich pre- and post-earthquake training dataset and structural improvement to enhance its generalization.关键词:remote sensing;multi-source images;deep learning;change detection;collapsed building extraction1483|966|0更新时间:2025-07-01
GeologyandDisasters
- “在空间信息度量领域,专家提出了基于像元邻域边界方形度的分类栅格数据空间信息度量方法,有效度量分类栅格数据的空间信息。”
 摘要:The category encoding values of classified raster data only represent semantic types without numerical significance. This characteristic poses challenges in directly applying current spatial information measurement algorithms to classified raster data, leading to elevated costs in applications such as cognition, analysis, comparison, and screening of classified raster data. To address this issue, this paper proposes a spatial information measurement method for classified raster data based on the squareness of pixel neighborhood boundaries, from the perspectives of feature similarity and diversity.In the method proposed in this article, the degree of similarity between pixel neighborhood boundaries and a reference square is utilized to quantitatively measure the spatial morphological information expressed by homogeneous pixels. The diversity probability entropy of heterogeneous pixels within the neighborhood is employed to quantitatively measure the spatial structural information conveyed by these pixels. This method designs an adaptive weight parameter w based on the maximum diversity entropy associated with the number of heterogeneous pixels within the neighborhood space, coupling spatial morphological information with spatial structural information. Two types of information components are combined to comprehensively express the spatial information content of classified raster data.Three sets of experiments were conducted to validate the effectiveness of the proposed method. The experimental results indicate that the measurement results of the proposed method are unaffected by changes in category encoding values and exhibit strong correlations with thermodynamic consistency and the fragmentation degree of raster data, with correlation coefficients all exceeding 0.98. Compared with existing representative methods, the trend of information change in empirical cognition is more consistent. In the application example in Xi’an, China, this method can quickly and intuitively compare the classification raster data of different resolutions and data sources and provide objective measurement data. The application results indicate strong heterogeneity in the information content of different data sources between urban and rural areas, which provides a theoretical basis for the comprehensive utilization of categorical raster data.In conclusion, the experimental results support the effectiveness of the proposed method in measuring the spatial information of classified raster data. It will play an important role in reducing costs and improving efficiency in applications such as cognitive, comparative, and filtering of classified raster data. However, current information content is limited to the spatial information dimension and fail to fully express the rich connotations of data. In future research, spatial information will be used as the basis to expand the coupling measurement of thematic information and spatial information in classification raster data. Moreover, future studies can explore the key role of information indicators in quantitative cognition and evaluation of classification grid data.关键词:Spatial Information Measurement;Classified Raster Data;information entropy;Morphological Information;Spatial Structural Information;Thermodynamic Consistency;Shape Similarity;data filtering122|235|0更新时间:2025-07-01
 - “在遥感科学研究领域,专家系统整理了从样区选择到几何位置匹配等关键环节的研究进展,提出了降低和控制像元尺度地面真值获取不确定性的理论方法框架,为提高地面真值的有效性、可信度和代表性提供解决方案。”
 摘要:Ground-based observations serve as the foundation of remote sensing scientific research, providing crucial data support for the construction of quantitative remote sensing models, accurate and efficient inversion of remote sensing information, and validation processes. However, due to the scale discrepancy between ground observations and remote sensing pixels, as well as the inherent spatial heterogeneity of land surfaces, ground observations exhibit representativeness errors. Directly using them as pixel-scale ground truth introduces significant uncertainties in subsequent collaborative analysis and processing of ground observation data and remote sensing data. To address this and acquire pixel-scale ground truth that infinitely approximates remote sensing pixel resolution, this study systematically reviews literature from 1987 to 2024 on pixel-scale ground truth acquisition. Through inductive and synthetic methods, we summarize research progress and conclusions across key stages: from site selection, spatial heterogeneity assessment, optimized ground sampling layout, field observations, and scale transformation to geometric co-registration. A theoretical framework is proposed to reduce and control uncertainties in pixel-scale ground truth acquisition. Results indicate: (1) For ground observation-derived pixel-scale truth (single/multiple sites), post-quality-control representativeness error constitutes the primary uncertainty source, addressable through representativeness evaluation, upscaling conversion, site optimization, and precise geometric matching; (2) For high-resolution airborne data-derived pixel-scale truth, uncertainties can be mitigated via data calibration, upscaling conversion, and geometric co-registration. In the future, the acquisition of pixel-scale ground truth should aim to minimize uncertainty, continuously optimizing the layout of ground sample points, scale conversion, geometric location matching, and data sharing mechanisms to improve the effectiveness, credibility, and representativeness of pixel-scale ground truth as the core “benchmark”.关键词:Satellite pixel scale ground truth;ground observation;scale difference;spatial heterogeneity;representativeness errors;uncertainty analysis;validation;accuracy assessment;training sample69|104|0更新时间:2025-07-01
 - “报道:海洋卫星数据融合技术取得新进展,专家提出有效波高融合新方法,为全球海洋监测提供新方案。”
 摘要:Significant Wave Height (SWH) is a crucial parameter in the study of ocean wave fields. Since the launch of GEOSAT in 1985, satellite altimeters have been providing global observations of SWH. However, the limitations of individual satellite orbit intervals and operation cycles mean that only the fusion of multi-satellite observation data can meet the needs of mesoscale wave field research. Currently, methods for fusing SWH data at specific times include the spatiotemporal inverse distance weighting method and the time-weighted averaging method used in CMEMS L4 products. However, the spatiotemporal inverse distance weighting method does not objectively allocate weights for temporal and spatial distances. Additionally, the time-weighted averaging method employed in CMEMS L4 products cannot meet the fusion requirements for dense grids at high spatial resolutions.This study utilized along-track 1 Hz SWH data from nine satellite observations. Initially, the multi-source satellite observation data were matched with buoy data from the National Data Buoy Center (NDBC). Calibration was then performed using least squares regression analysis. A filtering method based on Empirical Mode Decomposition (EMD) was applied to the calibrated SWH data. By exploring the equivalence between spatial and temporal distances at the same error level, the influence of spatial and temporal dimensions on the fusion results was unified, leading to the development of a novel spatiotemporal fusion method for SWH.Through a systematic study of the fusion process, we found that the spatial window size affects the proportion of blank grids. The error of the fusion results decreases initially and then increases with the enlargement of the temporal window. Compared with the CMEMS L4 products and traditional spatiotemporal weighting fusion methods, our fusion method demonstrates good consistency in global spatiotemporal distribution characteristics and reduces errors by 4.1 and 1.55 cm, respectively. Additionally, the proposed fusion method exhibits high-resolution fusion capabilities.This study proposes a new method for SWH fusion and conducts a detailed investigation into parameter selection within this method. The improvements not only demonstrate the potential of the new method in enhancing the accuracy of SWH fusion products but also increase the practicality and precision of SWH products in various ocean applications. Furthermore, this study provides valuable reference points for future applications in ocean wave observation and prediction. The combination of 4—9 satellites within a 24-hour temporal window and three satellites within a 30-hour temporal window, along with the optimal spatial window provided in this study, yields the highest accuracy in the final fusion results. However, several areas need improvement. Future research should incorporate detailed and accurate sea ice datasets, considering factors such as sea ice concentration, ice edge, and ice type, to assess the impact on grid masking in high-latitude regions.关键词:microwave remote sensing;satellite altimeter;Significant wave height;EMD filtering;remote sensing data fusion;spatiotemporal interpolation method;buoy validation135|234|0更新时间:2025-07-01
 - “在农业领域,研究人员开发了新型光学水稻指数NOPRI,准确绘制水稻分布图,为精准农业规划和粮食安全评估提供可靠依据。”
 摘要:Rice is one of the most crucial food crops globally, serving as the primary source of sustenance for nearly 50% of the world’s population. Its significance extends beyond mere food provision, as the cultivation process demands substantial water resources, and flooded rice fields contribute significantly to methane emissions, thereby presenting formidable challenges to food security and ecological equilibrium. In this context, precisely determining the distribution areas of rice cultivation emerges as a pivotal task for effective food security and ecological environment management.Traditional manual survey methods have long been constrained by their limited scope and labor-intensive nature. By contrast, remote sensing technology has emerged as a powerful alternative, enabling the efficient monitoring of large-scale and long-term rice cultivation. By capitalizing on imagery data from satellites or aerial platforms, remote sensing offers comprehensive coverage, facilitating in-depth and detailed monitoring of rice cultivation regions.However, existing paddy rice mapping methods have issues such as high sample demand, complex parameter settings, and poor applicability. To address the need for rapid and accurate rice distribution mapping, this research has introduced an innovative optical paddy rice index known as NOPRI. The construction of NOPRI is a meticulously designed process. Initially, leveraging the Google Earth Engine platform, the Sentinel-2 Level 1C image products corresponding to the target area and year were acquired. Subsequently, cloud masking was executed to eliminate the interference of cloudy pixels, followed by the calculation and generation of the time series of the Normalized Difference Vegetation Index (NDVI) and the Modified Normalized Difference Water Index (MNDWI). These indices play a fundamental role in characterizing the growth and environmental conditions of rice. Harmonic analysis was then employed to reconstruct the NDVI and MNDWI time series, effectively enhancing the visualization and understanding of the periodic patterns inherent in rice growth. The coefficients derived from this time-series harmonic analysis were utilized to quantitatively assess the unique time-series characteristics of rice. Through a concise statistical analysis of a relatively small number of samples, the feature coefficients were extracted, refined, and combined. Notably, the characteristics of MNDWI during the critical rice flooding period were integrated into the index formula, enhancing the discriminatory power of NOPRI.This study achieved remarkable success in mapping the rice distribution in Region 1 in 2019, Region 2 in 2019, Region 3 in 2022, and Region 4 in 2018 by applying index threshold segmentation. To rigorously evaluate the accuracy of these maps, we conducted a comprehensive assessment using 7,001 validation sample points. The outcomes revealed that the overall accuracy of NOPRI surpassed 0.945, and the F1 score exceeded 0.907, providing strong evidence of the high reliability of the mapping results. In the evaluation of the mapping effect, a detailed visual comparison between the enlarged views of the rice distribution maps and the Sentinel-2 RGB images demonstrated striking similarity. In contrast to the Synthetic Aperture Radar-based Paddy Rice Index and existing rice datasets, NOPRI exhibited superior extraction accuracy and more precise mapping effects. However, the performance of NOPRI is susceptible to the quality of optical data. In research areas where the long-term quality of optical data is suboptimal, the extraction accuracy and mapping effect of the rice index may be compromised. Future research efforts should focus on devising strategies to mitigate the impact of data quality issues and enhance the robustness and applicability of NOPRI.关键词:remote sensing;rice;Sentinel-2;time series;Time series harmonic analysis;paddy rice index377|406|0更新时间:2025-07-01
 - “本报道介绍了一种基于多源遥感数据的降尺度雪深反演算法,为水文建模和灾害预报提供高时空分辨率雪深数据。”
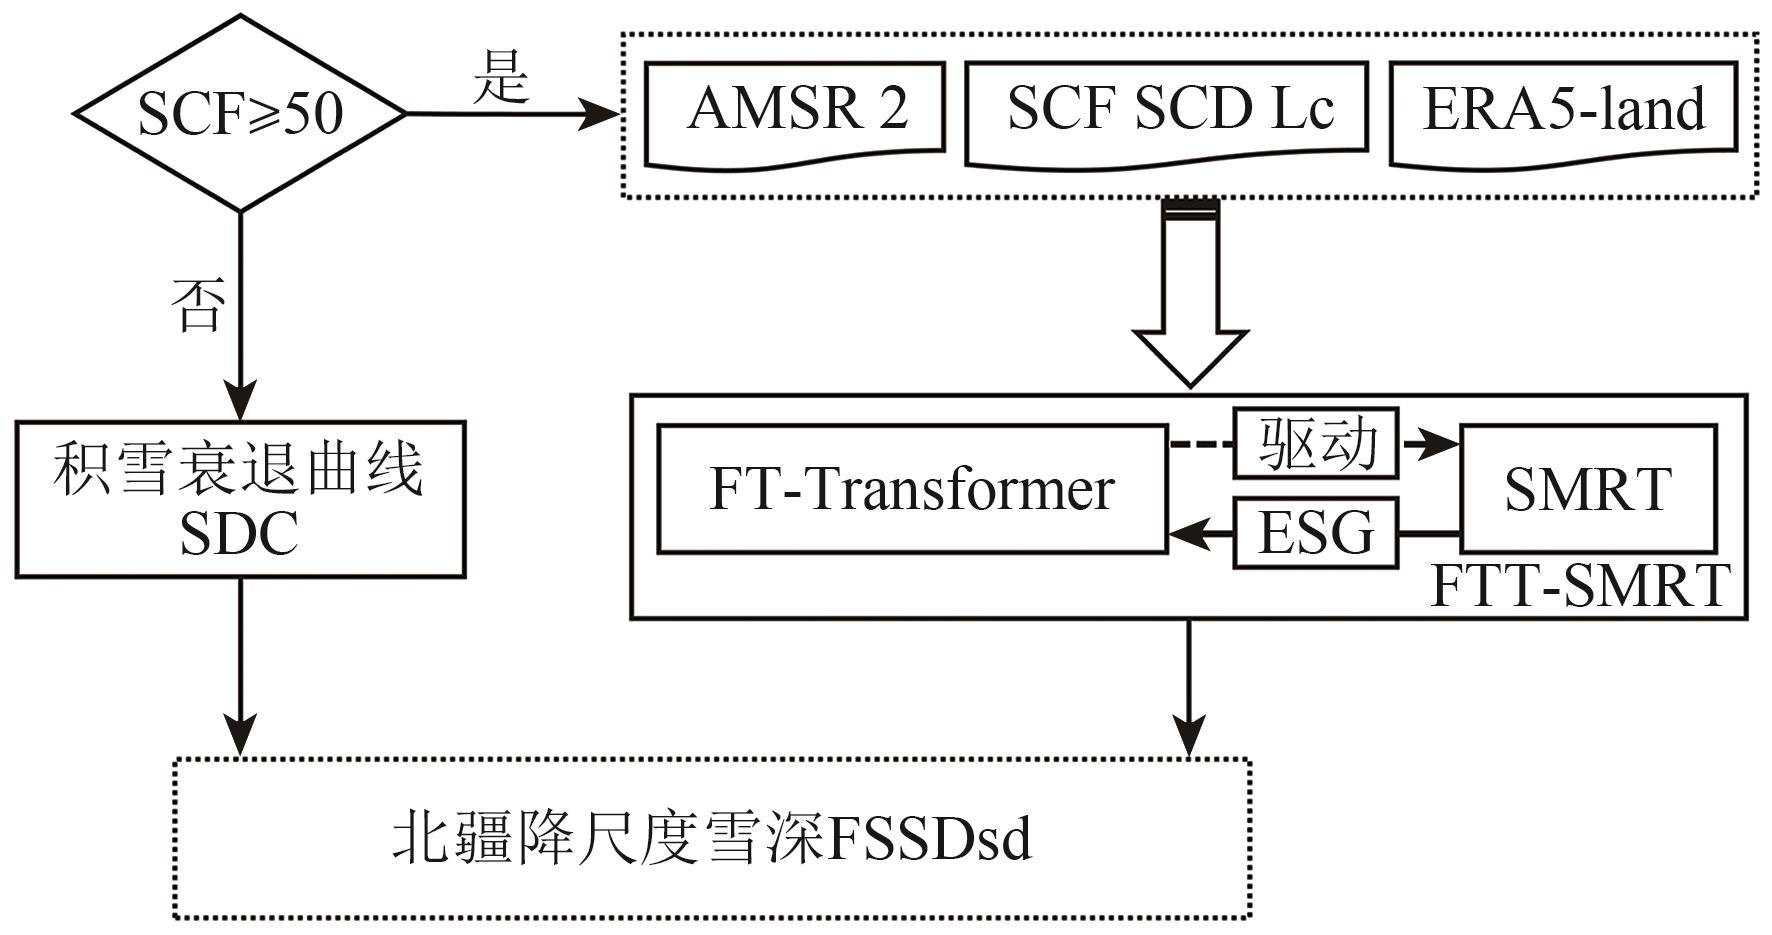 摘要:High spatiotemporal resolution snow depth data are crucial for hydrological modeling and disaster forecasting. Currently, high temporal resolution snow depth data are typically derived from passive microwave measurements, which has not been able to meet the needs of regional hydrological and disaster studies due to the low spatial resolution based only on passive microwave data. On the basis of passive microwave brightness temperature data and combined with high-resolution optical remote sensing data, this paper aims to develop a high-precision downscale snow depth inversion algorithm to provide high spatial and temporal resolution snow depth data for regional-scale hydrology and climate research.This study proposes a downscaling snow depth retrieval algorithm based on multi-source remote sensing data such as passive microwave and optical, coupled with a deep learning model (Feature Tokenizer + Transformer, FT-Transformer) and a Snow Microwave Radiative Transfer (SMRT) model. Deep learning is used to map the complex nonlinear relationship between features such as AMSR 2 brightness temperature difference (TBD), Snow Cover Days (SCD), Snow Cover Fraction (SCF), and snow depth. Considering the influence of the physical properties of snow, the coupled SMRT is fitted with the Effective Snow Grain size (ESG) to characterize the spatiotemporal dynamic snow properties, and it is input into the deep learning model to achieve downscale inversion of snow depth.This algorithm was used to obtain downscaled snow depth data at 500 m spatial resolution in northern Xinjiang. Model training and validation were conducted using observed data from 39 stations in northern Xinjiang. The validation results revealed that SCD can effectively represent the snow accumulation process. Independent validation showed an 18% improvement in RMSE, indicating enhanced spatial generalization capability of the model. The inclusion of the ESG feature significantly improved the overall accuracy of the deep learning-based downscaled snow depth retrieval, resulting in an RMSE of 6.82 cm. This represents a 15% improvement compared with the model without the ESG feature. Additionally, the inclusion of the ESG feature greatly mitigated the underestimation of deep snow (>40 cm), leading to a 35% improvement in RMSE for such conditions. Furthermore, the time series analysis shows that ESG is consistent with the trend of measured snow depth, thereby constraining and stabilizing the output of the FT-Transformer model. Finally, compared with existing snow depth products such as AMSR2, ERA5-Land, and SDDsd, the downscaled snow depth data from this study exhibited superior validation accuracy, with an RMSE of 6.51 cm. The spatial distribution of snow depth was also refined, particularly capturing the complex snow depth heterogeneity in the mountainous regions of northern Xinjiang.This study explored the feasibility of combining the SMRT model with deep learning for downscaled snow depth retrieval. It obtained a downscaled snow depth product with high accuracy performance in northern Xinjiang, providing a reliable snow depth inversion method with high spatial and temporal resolution for hydrological modeling and disaster forecasting.关键词:remote sensing;snow depth;Downscaling algorithm;deep learning;SMRT;AMSR 2;snow cover days307|969|0更新时间:2025-07-01
 - “国内商业航天企业航天宏图成功发射航天宏图一号卫星,验证了其在地形测绘领域的高精度优势,为“女娲星座”业务化应用提供重要参考。”
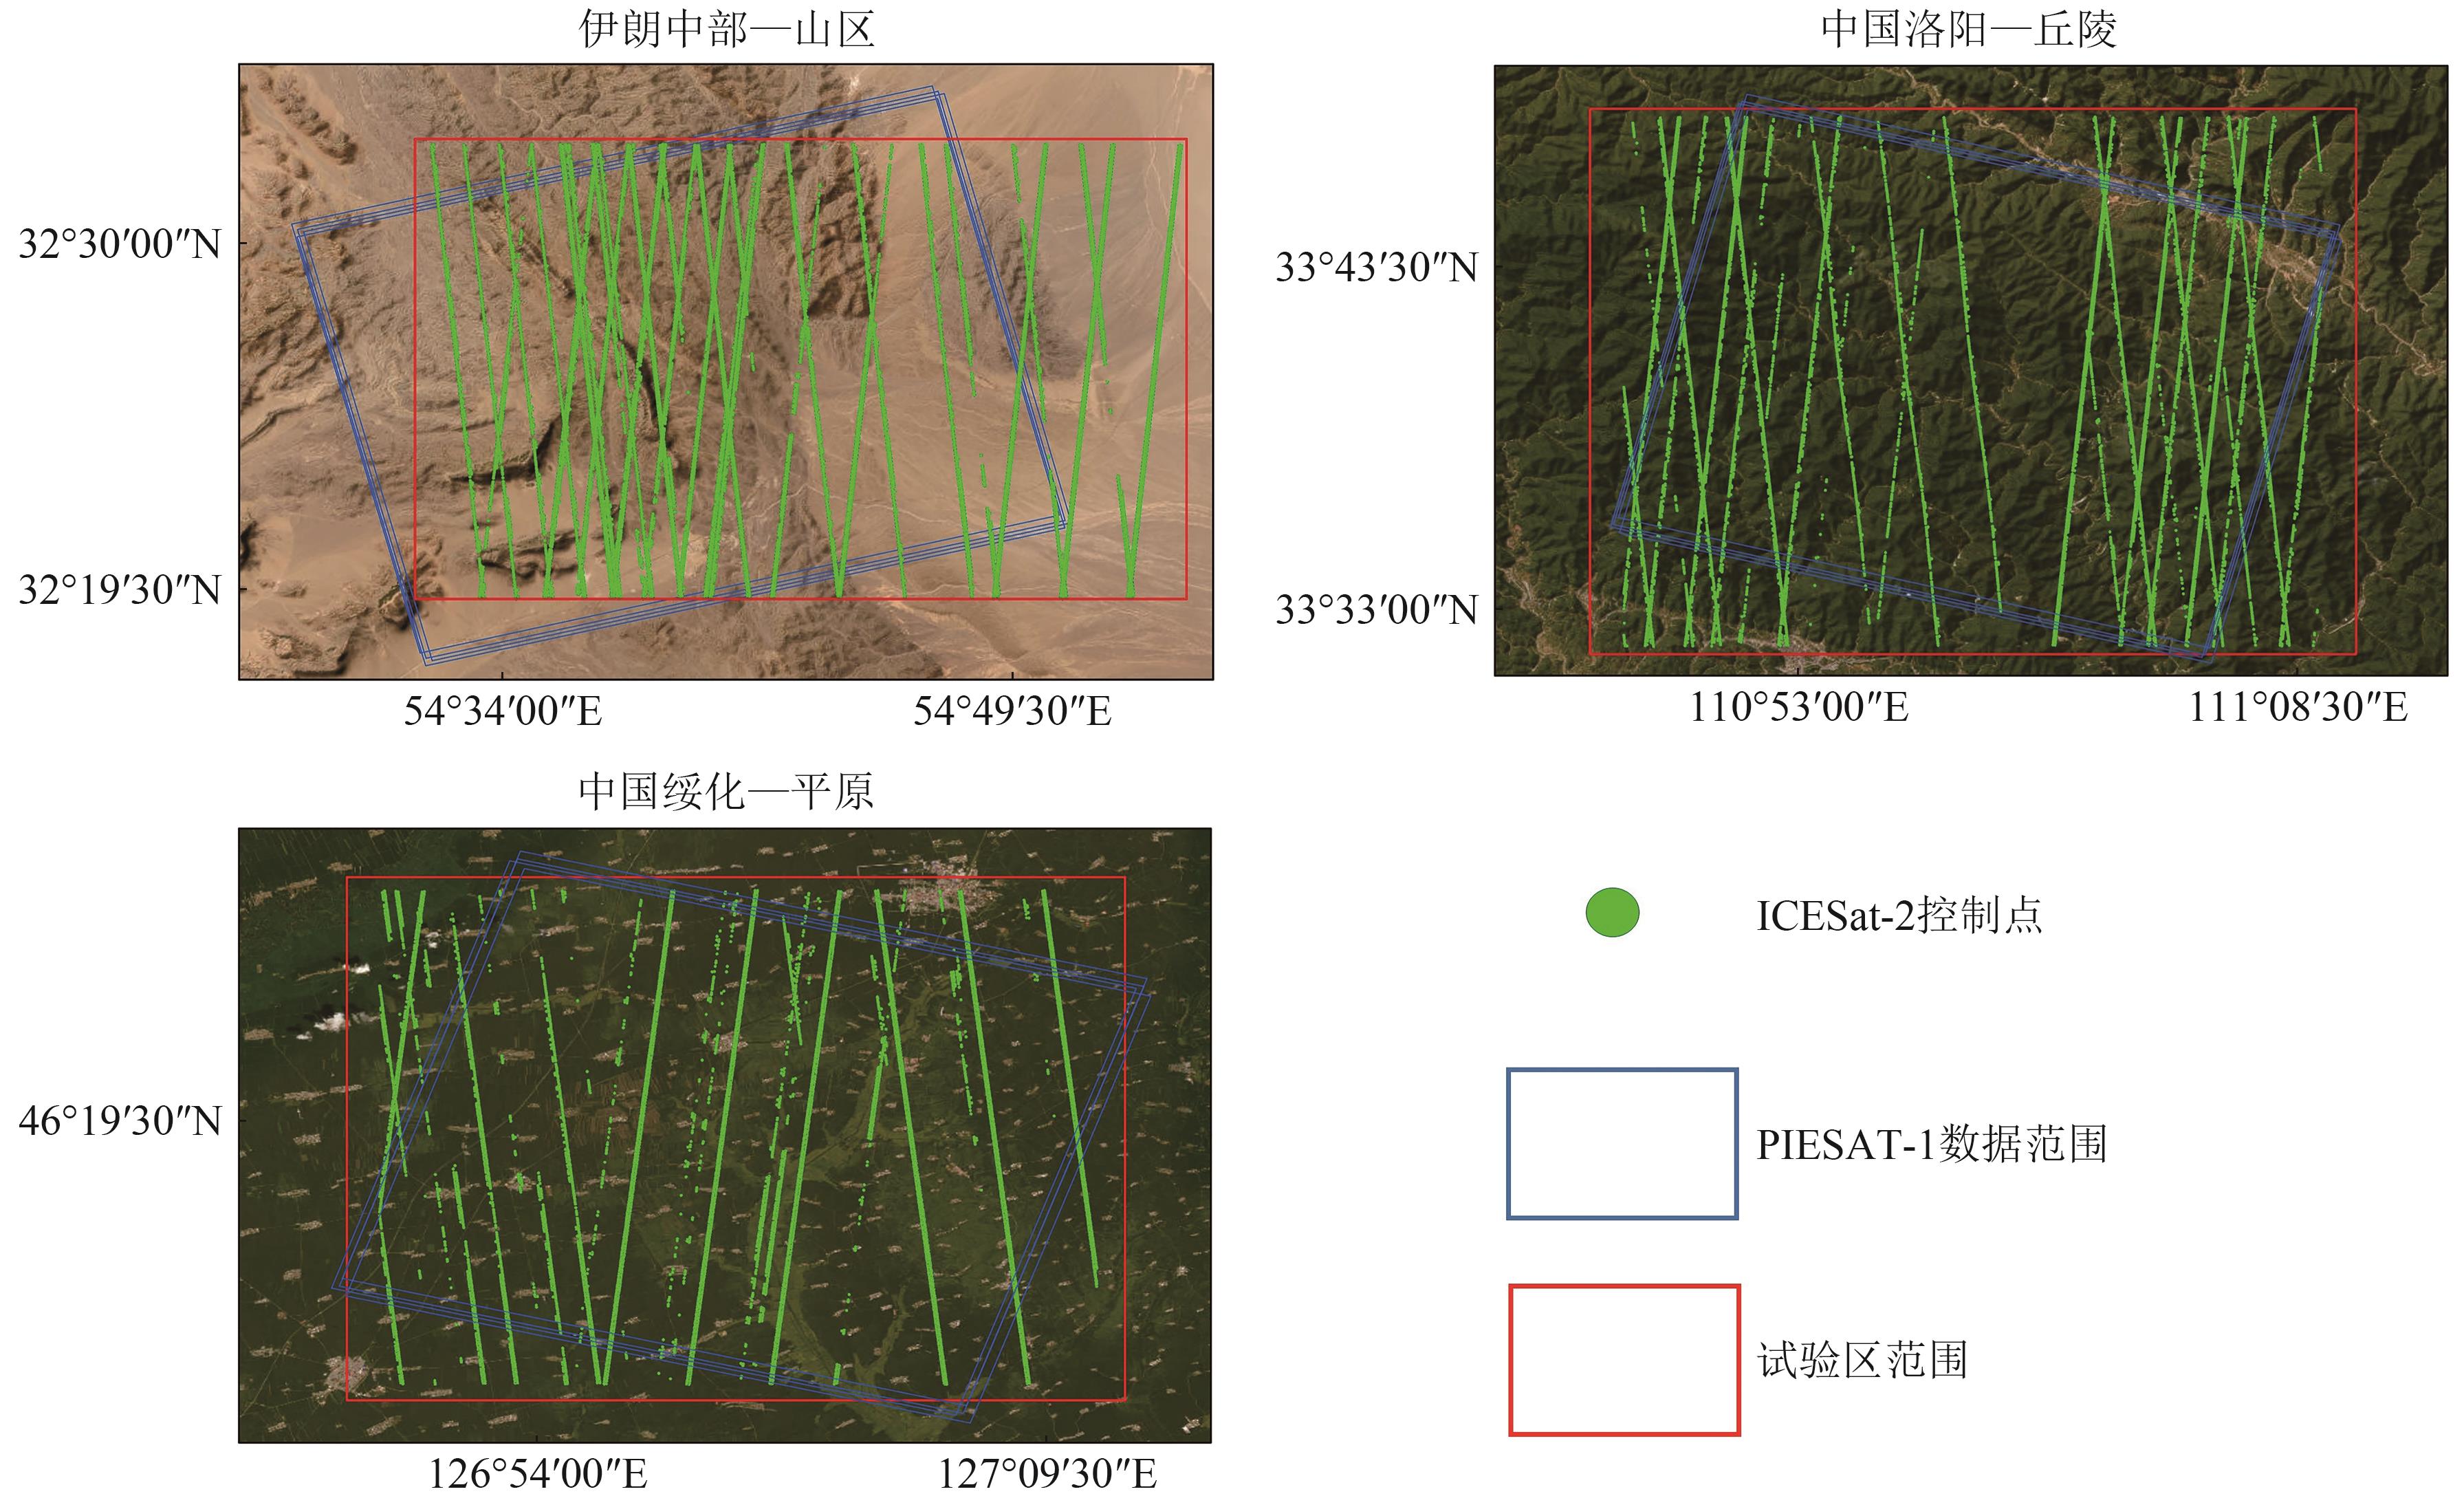 摘要:On March 30, 2023, the PIESAT-1 satellite, operated by the domestic commercial space enterprise Piesat Information Technology Co., Ltd. (hereinafter referred to as Piesat), was successfully launched, providing novel insights into the development of domestic SAR satellites. As the first star of “Nüwa Constellation,” it has the ability of high-precision topographic mapping, high-resolution wide-range imaging and high-precision deformation monitoring. However, studies on this satellite are limited, and its real mapping capability must be urgently explored. In this paper, we utilize the on-board InSAR to produce DEM technology and make corresponding technical adjustments for the unique “1 main + 3 auxiliary” wheel formation configuration of PIESAT-1.This study aimed to explore the PIESAT-1 interferometric terrain mapping capability and the advantages of the unique formation format.First, three special terrains, namely, mountain, hill, and plain, are selected as the research objects, combined with the L1B data acquired during the in-orbit test of PIESAT-1 satellite. The DEM is extracted using InSAR technology. In the extraction step, the multi-baseline phase unwrapping brought by the four-star constellation of PIESAT-1 is fully utilized, and the high-precision DEM is extracted by combining with the TSPA multi-baseline phase unwrapping method. Finally, the ICESat-2 control points and the Copernicus DEM are used as the references to validate the accuracy of the terrain mapping of PIESAT-1.(1) The vertical accuracy of the PIESAT-1 DEM product is higher than that of Copernicus DEM under the three terrain conditions of mountains, hills, and plains, with the RMSE values of 4.8727, 7.8329, and 0.9857 m, respectively.(2) The unique formation configuration of PIESAT-1 can effectively reduce the elevation error caused by vegetation. It makes the spatial resolution of PIESAT-1 DEM products better than that of Copernicus DEM products, and it is able to depict the detailed features of the terrain clearly.When PIESAT-1 is used in the global topographic mapping mission, the unique formation method gives it a great advantage in spatial resolution, mapping efficiency, and measurement accuracy, which provides an important reference for the operational application of “Nuwa Constellation.”关键词:PIESAT-1;Satellite-based InSAR terrain mapping;ICESat-2 control points;Multi-baseline phase unwrapping;DEM accuracy validation;Vegetation impacts109|383|0更新时间:2025-07-01
Models and Methods
- Postal code:100190
- Tel:010-58887052 Email:nrsb@aircas.ac.cn
- Technical support is provided by Beijing Founder electronics co., LTD 京ICP备20021838号-9
 京公网安备11010802024621
 - It is recommended to read the content of this site in Chrome&IE9+. Please switch to extreme mode in browser 360.
- Cookies We use cookies to help provide and enhance our service and tailor content. By continuing, you agree to the use of cookies.

0