
最新刊期
卷 29 , 期 9 , 2025
- “最新研究显示,高光谱影像结合DEM、土壤水分及地上生物量数据能有效反演天然次生林土壤有机碳含量,为林业可持续发展提供技术支持。”
 摘要:Forest Soil Organic Carbon (SOC) is a critical indicator of forest soil quality, significantly affecting the growth of forest trees and playing an essential role in the sustainable development of forestry. Investigating the potential of utilizing hyperspectral images to accurately determine the SOC in natural secondary forests is imperative. This investigation would aid in providing technical assistance for estimating forest SOC on a long-term and large-scale basis. With a focus on the SOC of natural secondary forests, this study randomly selected a total of 67 samples in the Maoershan Experimental Forest Farm of Northeast Forestry University. Soil samples were collected from three different depths: 0—5 cm, 5—15 cm, and 15—30 cm. The SOC content of each sample was measured, and the mean of the three layers was calculated as the SOC content for 0—30 cm depth. The hyperspectral image of ZY-1F was analyzed to calculate the first-order differential, second-order differential, reciprocal logarithm of the spectral curve, and vegetation indices. The Recursive Feature Elimination (RFE) method was then employed to screen the features, taking into account the Digital Elevation Model (DEM), soil moisture, and forest Aboveground Biomass (AGB) datasets. Three machine learning models, namely, random forest, Extreme Gradient Boosting (XGBoost), and support vector regression, and ordinary least squares regression were employed to estimate the SOC content, and the best model was chosen to estimate the SOC at various depths. Results showed that XGBoost had the highest accuracy in various soil depths: the R2 for the soil depths of 0—30 cm, 0—5 cm, 5—15 cm, and 15—30 cm were 0.54, 0.54, 0.46, and 0.30, respectively, and the RMSEs were 21.28, 44.25, 15.72, and 12.56 g/kg, respectively. The average SOC values in the natural secondary forest of Maoershan Forest Farm were estimated to be 67.20, 88.87, 46.92, and 40.12 g/kg for the 0—30 cm, 0—5 cm, 5—15 cm, and 15—30 cm soil layers, respectively. The SOC concentration in the forest declined as the soil depth increased. Variations in SOC content exist across various forest types, and the SOC is ordered in descending order as follows: broad-leaved forest, mixed coniferous and broad-leaved forest, and coniferous forest. The band information from hyperspectral images enables the estimation of the SOC in forests. However, the large number of bands leads to data redundancy, which in turn reduces the accuracy of the model’s estimates. The RFE method can be employed to identify the optimal combination of features, thereby reducing the amount of features and enhancing the accuracy of model estimate. The differential characteristics of the 710—850 nm bands in hyperspectral images are extremely beneficial for accurately estimating the SOC in natural secondary forests. Topographic factors exert a more significant influence on the SOC at depths above 15 cm, while soil moisture and AGB have a more pronounced effect on SOC in the 5—15 cm layer compared with other factors. The integration of hyperspectral images with DEM, soil moisture, and AGB data facilitates the accurate estimation of the SOC content of natural secondary forests. This approach offers valuable support for estimating long-term and large-scale SOC of natural secondary forests on the basis of multiperiod hyperspectral images.关键词:natural secondary forest;SOC;hyperspectral;machine learning model;feature selection266|365|0更新时间:2025-09-30
 - “在地表温度反演领域,专家构建了GF-5B热红外数据地表温度反演劈窗算法,为提高地表温度反演精度提供解决方案。”
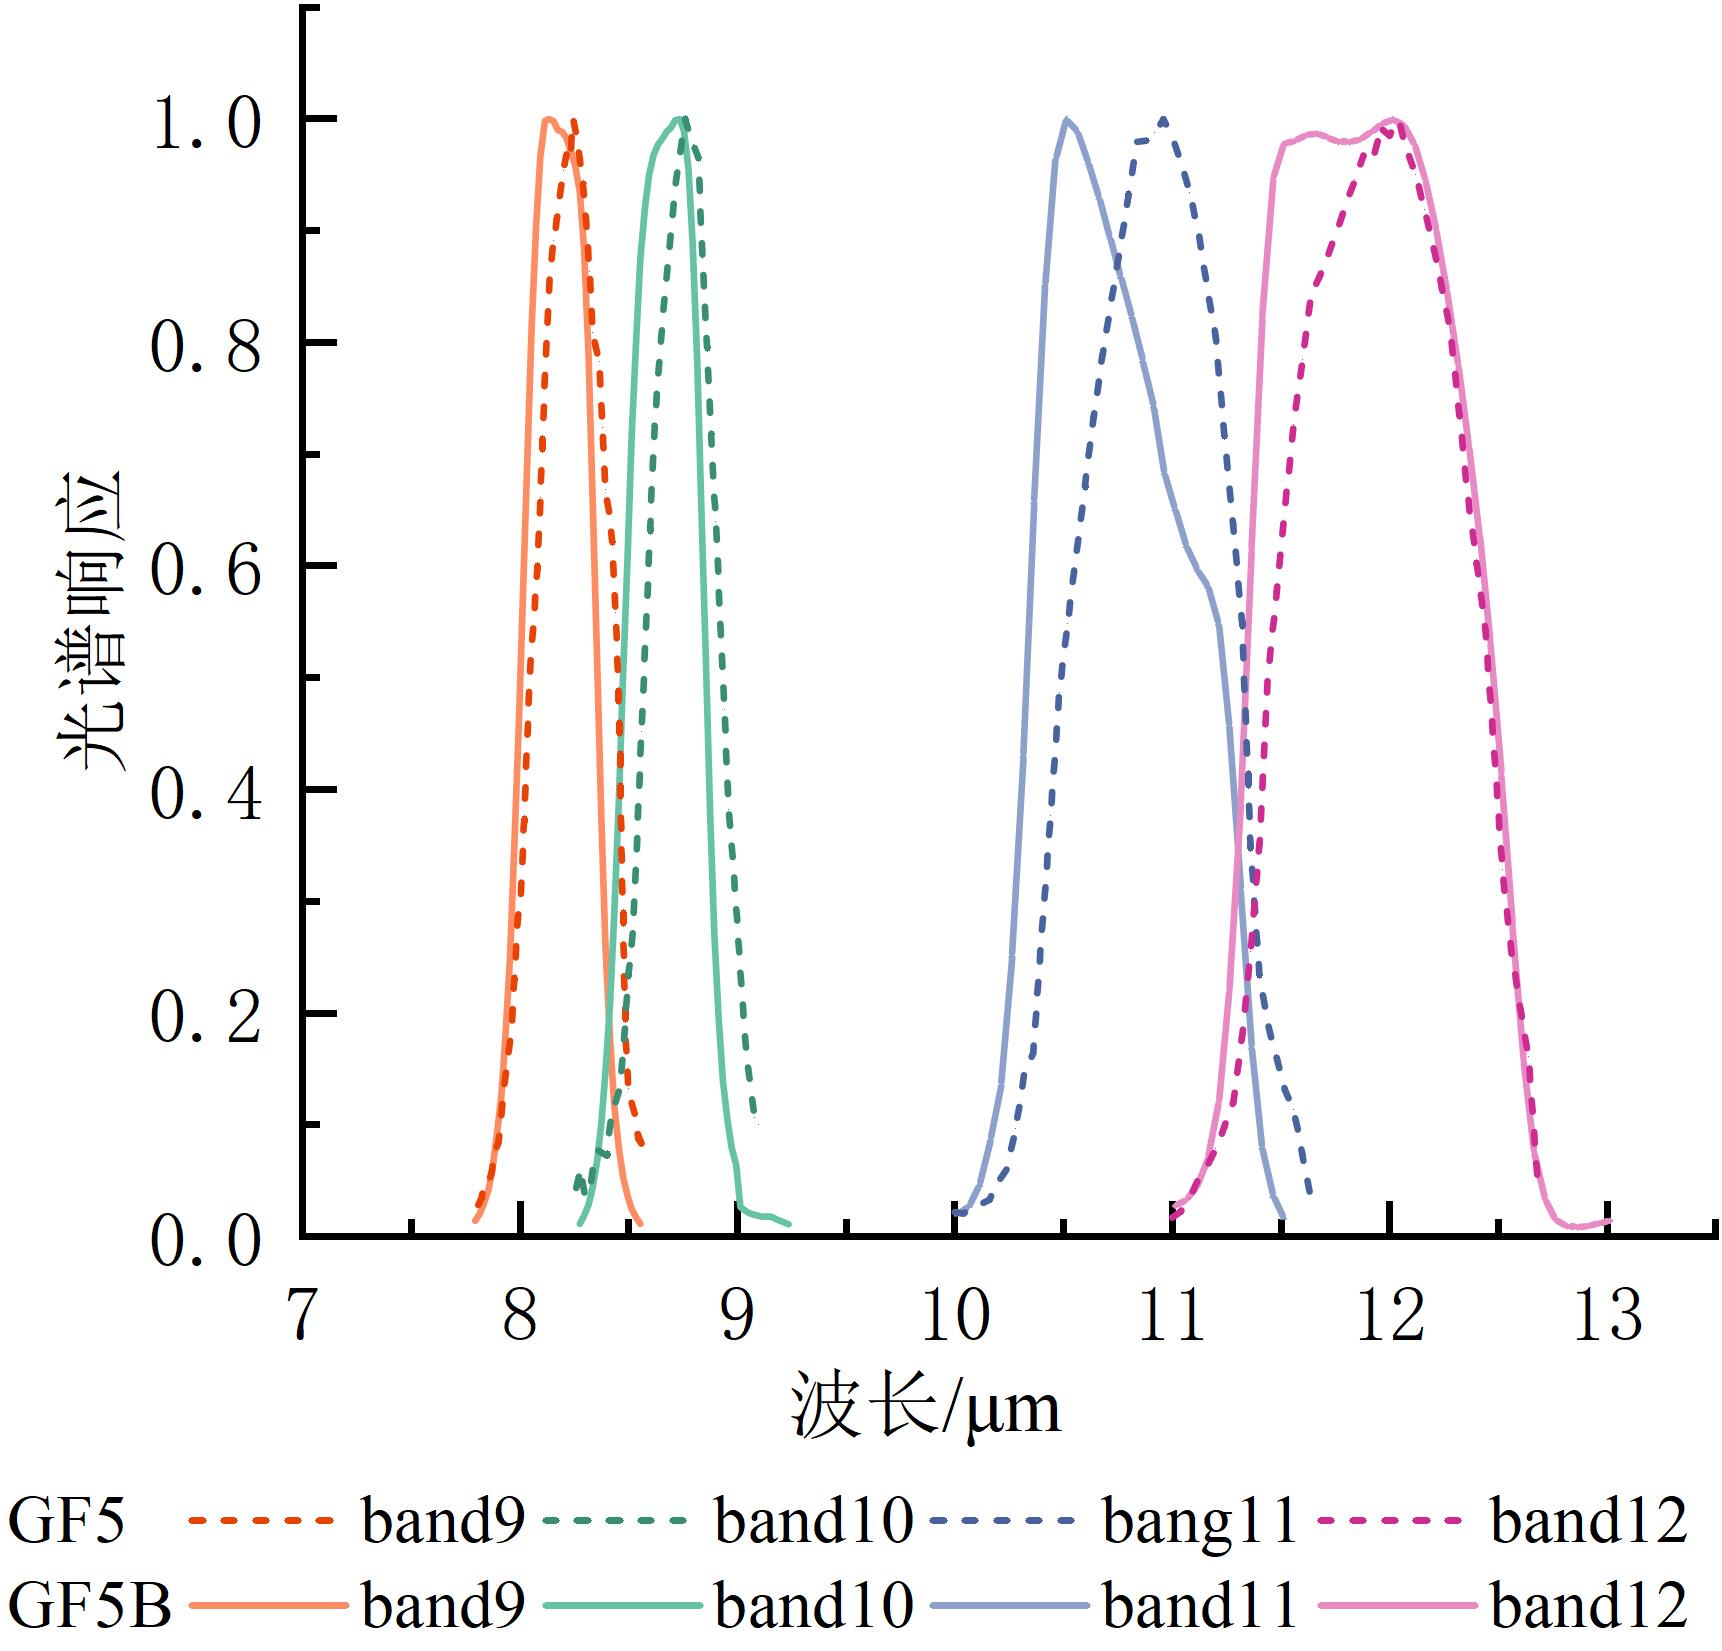 摘要:Land Surface Temperature (LST) is a critical parameter for understanding surface energy balance and water cycle processes. This study aimed to develop LST retrieval algorithms using thermal infrared data from the Visual and Infrared Multispectral Imager (VIMI) onboard Chinese Gaofen-5B (GF-5B) satellite, providing a new data source for global high-spatial-resolution LST product generation.A simulated dataset was first constructed on basis of the conventional thermal infrared radiative transfer model, TIGR-3 atmospheric profiles, and 74 typical surface emissivity samples selected from the ASTER spectral library. Two split-window algorithms (called as SW-1 and SW-2) for GF-5B thermal infrared data were developed based on the simulated dataset and sensor characteristics, with both algorithms achieving an RMSE of 1.13 K. Considering the influence of Column Water Vapor (CWV) on LST retrieval, algorithm coefficients were derived under different CWV conditions. Comparison of RMSE under identical conditions demonstrated that SW-2 generally outperformed SW-1 in accuracy. The algorithm’s performance varies with CWV, with RMSE values of SW-1 (SW-2) decreasing from 1.41 K (1.34 K) in high CWV conditions (4.5—6.3 g/cm²) to 0.40 K (0.39 K) in low CWV conditions (0.0—2.5 g/cm²). The SW-2 algorithm was thus recommended as the preferred choice for GF5B-based LST retrieval applications. Key parameters acquisition methods were also proposed, including land surface emissivity (via a modified NDVI-NDWI threshold method) and atmospheric CWV (via a water vapor split-window covariance-variance ratio method).The proposed algorithm was applied to four experimental regions with different land cover types. Combined with false-color composite imagery (green, red, and near-infrared bands) derived from VIMI’s visible and near-infrared data, the spatial distribution of LST retrieval results was evaluated in relation to surface characteristics. Artificial surfaces and bare soil exhibited relatively higher LST values, while water bodies and vegetation showed lower LST values, consistent with thermal radiative characteristics. Validation was conducted using in-situ LST measurements from HiWATER sites and MODIS LST products. Results demonstrated that the LST errors for daytime and nighttime retrievals were 1.88 K and 0.99 K, respectively. Among all validated data, the maximum daytime temperature difference reached 2.86 K, while the nighttime maximum difference was 1.27 K. Additionally, variations in validation accuracy were observed across imagery acquired at different periods for the same site. For cross-comparison with MODIS MOD11A1 LST products, observational discrepancies were minimized by aligning acquisition times and viewing angles, and spatial aggregation was applied to reduce the impact of resolution mismatches. High-resolution Sentinel-2 land cover products and temperature gradients between adjacent pixels were utilized as screening criteria. Except for the Tangshan (Hebei) region, which exhibited significant deviations due to cloud contamination, temperature differences in the remaining three regions remained within 1.5 K.The LST retrieval results across the four experimental regions exhibited reasonable spatial distributions and strong correlations with land cover types. Validation with limited in-situ HiWATER data confirmed higher accuracy for nighttime retrievals compared to daytime. Cross-comparison with MOD11A1 LST products demonstrated acceptable agreement (differences ≤1.5 K) in three regions, indicating that the proposed algorithm achieves satisfactory accuracy.关键词:GF-5B;thermal infrared data;Land Surface Temperature (LST);split-windows algorithm;land surface emissivity estimation;atmospheric water vapor content (CWV) estimation;accuracy validation;in-situ LST measurements validation;cross-comparison of LST53|90|0更新时间:2025-09-30
 - “在卫星遥感领域,专家提出了融合卫星激光测高数据的高分七号卫星影像数字表面模型BP神经网络方法,有效改善了沟壑发育地表无控条件下卫星立体影像生成DSM高程精度质量低的问题,为国产高分影像推广应用与高精度地形建模提供新思路。”
 摘要:The accuracy of Digital Surface Models (DSMs) reconstructed from satellite stereo imagery is generally lower in rugged gully-dominated landscapes than in flat areas, especially in the absence of Ground Control Points (GCPs). Moreover, collecting GCPs in large and rugged areas is often operationally challenging or costly. To improve the accuracy of DSMs derived from satellite stereo imagery, this study proposes a method that integrates laser altimetry data with DSMs generated from Gaofen-7 (GF-7) satellite stereo imagery using a backpropagation (BP) neural network. The proposed method seeks to improve terrain DSM accuracy in areas where GCPs are either scarce or costly to obtain, providing an efficient solution for terrain modeling in such regions.Considering the high-precision elevation accuracy of laser altimetry data, the proposed method improves the DSM accuracy without GCPs through establishing relationships between multiple factors and elevation data from the Global Ecosystem Dynamics Investigation mission. These factors include the DSM generated from GF-7 satellite stereo imagery without GCPs, geographic coordinates (longitude and latitude), terrain slope, and terrain errors. This fusion is achieved through the use of a BP neural network, which is trained to model and enhance the accuracy of the DSM under uncontrolled conditions. The study area is located in the Loess Plateau region spanning Shaanxi Province and Inner Mongolia Autonomous Region, China. The terrain has the characteristics of severely eroded loess gullies, intensive mining activities, and dramatic undulations. The proposed method is tested across regions covered with different numbers of images, and its performance is validated through comparisons with ground-truth data measured by RTK.Experimental results show that the elevation error of the GF-7 stereo-derived DSM in gully-developed mining areas without GCPs can reach up to 20.49 m. By contrast, the average elevation accuracy of the fused DSM is significantly improved to 1.63 m after applying the fusion technique using the BP neural network, which is comparable to the accuracy of the DSM generated with GCPs (1.44 m). When quality-filtered laser altimetry points are utilized as substitute GCPs directly, the elevation accuracy of DSM can also be refined to 2.40 m. However, the proposed comprehensive multifactor fusion method yields better performance (1.63 m vs. 2.40 m), confirming the advantage of fusion approaches. The improvement in elevation accuracy demonstrates that, whether used directly as GCP substitutes or through data fusion approaches, laser altimetry data can effectively enhance the vertical accuracy of DSMs derived from GF-7 satellite stereo imagery without GCPs.The findings of this study show that the proposed BP neural network-based fusion method significantly enhances the accuracy of DSMs generated from GF-7 satellite stereo imagery in areas without GCPs. This approach effectively solves the problem of low elevation accuracy in regions with complex topography, such as gully-developed mining areas. This study not only provides an innovative solution for terrain modeling in areas lacking GCPs but also offers a new way to utilize domestic high-resolution satellite imagery for high-precision terrain reconstruction. This method contributes to the advancement of terrain modeling techniques, especially in regions where obtaining GCPs is difficult or impossible, and provides a viable solution for reducing labor costs, improving operational efficiency, and reconstructing high-quality terrain DSMs.关键词:digital surface model;Ground Control Points;neural network;gully-developed areas;GF-7 satellite stereo imagery;GEDI(Global Ecosystem Dynamics Investigation)150|353|0更新时间:2025-09-30
Chinese Satellites

- “非洲森林损毁研究取得新进展,专家构建决策树规则分类框架,揭示人为因素是主要驱动力,为森林保护提供科学依据。”
 摘要:Identifying the drivers of forest loss is essential for developing forest management policies, yet accurately and comprehensively classifying these drivers on a large scale remains a significant challenge. In this study, we focused on Africa, a region experiencing severe forest loss due to various human activities and natural disturbances. Our objectives are twofold: (1) to generate a spatially explicit and dynamic dataset for proximate drivers of forest loss and (2) to quantitatively analyze their spatiotemporal patterns.Our approach consists of three main steps. First, we developed a decision tree-based classification framework to attribute annual forest loss in Africa to five human drivers and three natural drivers. This framework integrates multisource remote sensing data—including a global 30 m land cover dynamic monitoring dataset, human footprint pressure, fire occurrences, forest management practices, and the Standardized Precipitation Evapotranspiration Index—following a hierarchical approach based on identification difficulty. Second, we validated the driver classification results by using approximately 15,000 third-party visual interpretation samples at a 1 km×1 km resolution. We compared our results with those of prior studies and systematically analyzed the sources of observed discrepancies. Finally, we quantified forest loss induced by different drivers across three spatial scales: the entire African continent, distinct geographical zones, and latitudinal gradients. We further examined temporal dynamics and long-term trends at continental and zonal levels.We developed a 30 m annual forest loss driver dataset for Africa (2000—2020) with an overall accuracy of 95.38% in pantropical regions. Over this period, Africa experienced an estimated forest loss of 93.51 Mha, with human activities responsible for 86.73% of the loss and natural drivers accounting for 13.27%. Agricultural encroachment was the leading driver, causing 44.02% of the total loss, followed by forestry activity (11.40%). On a finer scale (0.01°×0.01°), agricultural encroachment was the dominant driver in most areas. Its impact increased significantly, from 1.53±0.24 Mha/a (2001—2011) to 2.71±0.23 Mha/a (2012—2020), peaking at 3.01 Mha/a in 2014. Forestry activity declined slightly before 2012 but nearly doubled by 2020 (1.00 Mha/a vs. 0.52 Mha/a in 2001). All human drivers, except for impervious surface expansion, displayed significant accelerating trends. Agricultural encroachment showed the most pronounced increase (0.08 Mha/a², P<0.05), followed by forestry activity (0.03 Mha/a², P<0.05). By contrast, natural drivers remained stable or declined, with persistent drought showing a decrease of -0.01 Mha/a² (P<0.05). The dominance of human activities in African forest loss intensified over time, rising from 80.62% in 2001 to 90.38% in 2020. Agricultural encroachment remained the primary driver throughout 2000—2020, peaking at 49.50% of total loss in 2014. The contribution of forestry activity rose sharply from 9.93% in 2001 to 18.61% in 2020, surpassing human-induced fire as the third-largest driver after 2013.This study integrates multisource remote sensing datasets to develop a decision tree-based classification framework for identifying the proximate drivers of forest loss during 2000—2020 in Africa. The driver classification results achieved an overall accuracy of 95.38% in the pantropical regions. Our analysis revealed that human activities were responsible for nearly 86.73% of Africa’s forest loss during this period, with their impacts continuing to grow, whereas natural drivers accounted for only 13.27%. Among the human drivers, agricultural encroachment (44.02%) and forestry activity (11.40%) were the two most significant contributors to forest loss. Notably, the rate of forest loss driven by nearly all human drivers doubled over time, showing an accelerating trend. These findings highlight the urgent need for strengthened forest conservation efforts, as Africa remains far from achieving SDG 15.2 (sustainable forest management), particularly in regions facing rapid agricultural expansion.关键词:forest loss;proximate drivers;remote sensing;decision tree;Africa;time-series;agricultural encroachment;forestry activity150|208|0更新时间:2025-09-30
 - “在粮食安全领域,专家利用多源遥感数据,提出了一种样本自动生成策略,为丘陵山区水稻快速精准制图提供可靠方案。”
 摘要:Rice is a crucial global food crop, and the accurate, timely delineation of rice cultivation areas is vital for food security assessment and sustainable agricultural planning. Satellite remote sensing, integrated with advanced information technologies, has emerged as a pivotal tool for mapping the spatial distribution patterns and monitoring the growth dynamics of rice. However, in the hilly and mountainous regions of southwest China, frequent cloud cover, fragmented cultivation patterns, and high field sampling costs hinder efficient and reliable remote sensing-based rice mapping. To address these limitations, this study, focusing on Tongnan District in Chongqing Municipality, proposes a novel cropland parcel-scale rice automated sample generation and mapping framework, leveraging the complementary strengths of multisource remote sensing data. The framework operates through several key stages: First, with cropland parcels as the basic unit, an optical-SAR time-series feature set is constructed by utilizing multiperiod Sentinel-1 and Sentinel-2 data. Second, adaptive identification of rice growth stages is achieved by analyzing temporal VH polarization features from SAR data, which are sensitive to vegetation structure and moisture variations. Third, high-quality parcel-scale training samples are automatically generated by analyzing the rice seasonal pattern across different imaging modes, bypassing labor-intensive manual sampling. Given the above samples, automated rice mapping is implemented by combining feature optimization and random forest. Finally, we evaluate the reliability of the generated samples and the rice mapping results. Results indicate four critical findings: (1) The method generates spectrally representative samples, achieving high consistency with field data (spectral correlation similarity = 0.987; dynamic time warping distance = 4.719). These samples exhibit spatial heterogeneity and broad coverage, addressing inefficiencies and biases inherent in traditional manual sampling. (2) Feature selection can effectively reduce model complexity while ensuring classification accuracy. The contribution of transplantation period features is substantial, and the importance of SAR features is higher than that of optical features. The two types of data have complementary advantages and can synergistically improve the classification robustness under cloudy conditions. (3) The automated rice mapping achieves an overall accuracy of 89%, an F1 score of 89%, and a total area extraction error of -7.5%, validating its reliability in spatially heterogeneous landscapes. In hilly mountainous areas with significant spatial heterogeneity, a moderate number of samples with uniform spatial distribution can help improve the stability and generalization ability of the model. In addition, rice exhibits significant clustering in flat, well-irrigated areas. (4) The overall uncertainty of rice mapping in the study area is low (0.29), indicating that the mapping results are reliable. Uncertainty is mainly affected by the combination of environmental and agricultural management conditions, parcel morphology, and sample characteristics. In areas with flat topography, favorable irrigation conditions, regular parcels, and sufficient samples, the spectral characteristics of rice are significant, and the uncertainty of mapping is low. This study provides a reliable automated sample generation approach for rapid and precise rice mapping in hilly and mountainous areas and offers scientific foundation for developing sampling strategies, selecting optimal feature bands, and assessing uncertainty. Hence, it lays a credible basis for precision agriculture planning and food security assessment.关键词:hilly and mountainous areas;seasonal pattern;time-series remote sensing;cropland parcel-scale;automated sample generation;rice mapping103|275|0更新时间:2025-09-30
 - “最新研究揭示了辽宁省朝阳市森林病虫灾害的时空特征,为森林保护提供数据支持和监测方法。”
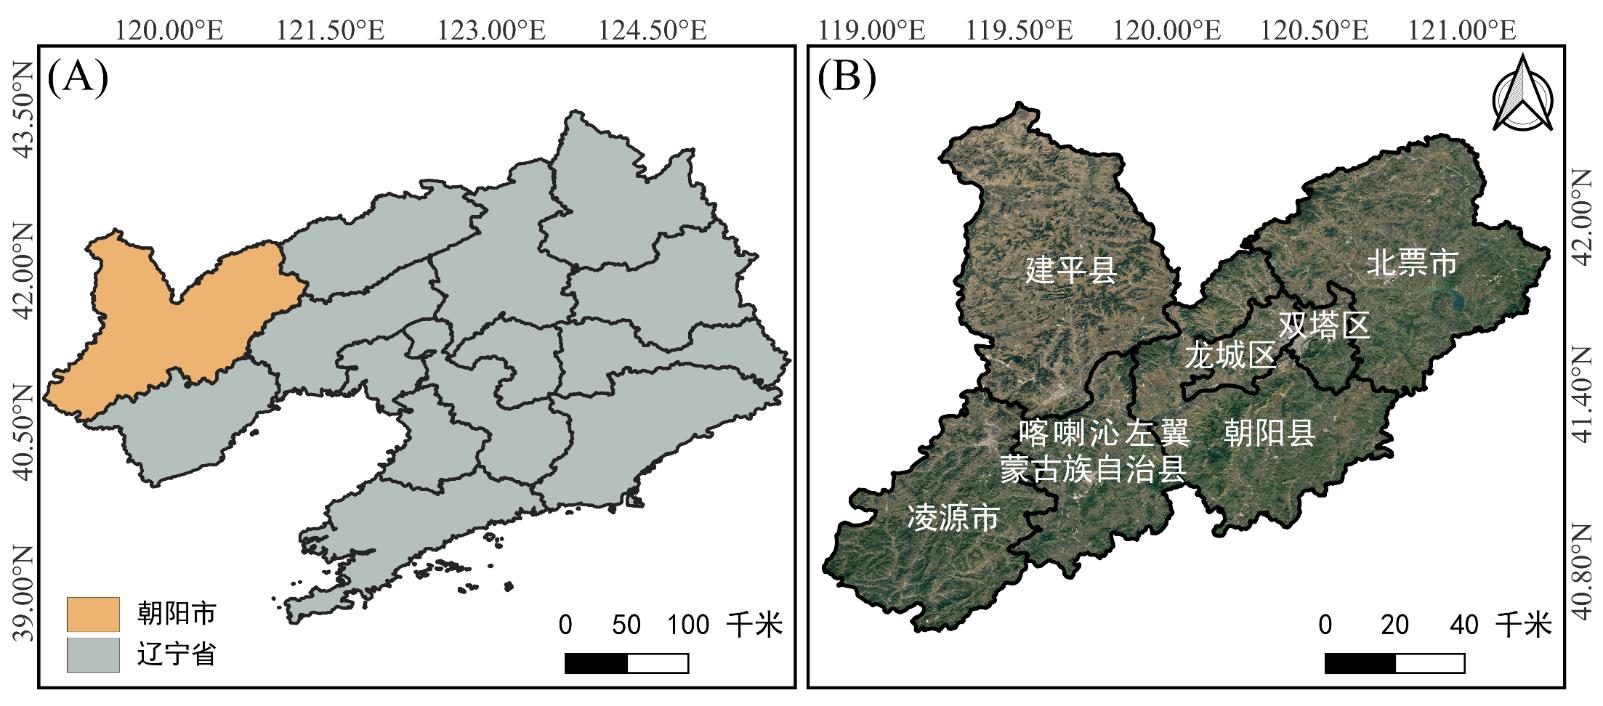 摘要:With the combined effects of climate change and human activities, the frequency and scale of forest disturbances caused by pests and diseases have been continuously increasing, significantly affecting the structure and services of forest ecosystems. Accurately identifying regional forest pest and diseases disturbances and analyzing the spatiotemporal characteristics of their outbreaks are of great significance for the protection of forest ecosystems. In this study, based on Landsat 8 satellite annual time-series data, with Chaoyang City in Liaoning Province as the study area, we comprehensively analyzed the separability of forest canopy temporal spectral characteristics for fire, logging, and pest and diseases. Adjusting the control parameters of the LandTrendr algorithm improved the “sensitivity” of extracting weak forest disturbance information. Ultimately, the random forest algorithm was used to extract spatiotemporal information of forest pest and diseases from 2013 to 2023. Results are as follows: (1) The temporal spectral characteristics of Landsat 8 satellite images precisely distinguish forest pest and diseases from fire and logging in Chaoyang City, providing a basis for identifying regional forest pest and diseases. (2) Time-series satellite images can provide spatiotemporal information of forest disturbances and be used for forest pest and diseases identification. The overall accuracy for forest disturbance identification and pest and diseasesmonitoring in this study was 89.3% and 86.6%, respectively, with Kappa coefficients of 0.785 and 0.812. (3) Forest disturbances in Chaoyang City are mainly due to pest and diseases, primarily occurring in Jianping County and Lingyuan City in the west, accounting for 67.97% of the total pest disturbance area in the city. The forest pest and diseasesin Chaoyang City exhibit an “intermittent” outbreak phenomenon in the temporal dimension. The study results can provide data support for forest management and offer methodological references for the classification of forest disturbances and the spatiotemporal monitoring of forest pest and diseases.关键词:Forest pest disaster;time series data;spectral analysis;LandTrendr algorithm;random forest algorithm425|475|0更新时间:2025-09-30
Forestry and Agriculture
- “在湿地植被和水体监测领域,研究者提出了跨平台多尺度影像特征映射模块,有效提升了卫星高光谱影像的空间分辨率,为湿地生态系统监测提供新方案。”
 摘要:Accurate time-series monitoring of wetland vegetation and water conditions using hyperspectral remote sensing is essential for the precise assessment and comprehensive evaluation of karst wetland ecosystems. However, the low spatial resolution of existing satellite-based hyperspectral images (satellite-based HSI) limits their ability to capture the complex spatial details of wetland vegetation, while the ultra-high-resolution unmanned aerial vehicle hyperspectral images (UAV-HSI) is insufficient for large-scale, time-series monitoring. In addition, existing super-resolution reconstruction methods face challenges in supporting cross-platform reconstruction between satellite-based and UAV-based images, and these methods could not fully meet the demands of time-series monitoring across extensive wetland areas. To address these challenges, this study proposes a cross-platform multiscale image feature mapping module (CMIFM). This module first performs spatial alignment and transformation between UAV-HSI and satellite-based HSI. Then, based on ground-measured spectral data acquired with the analytical spectral devices (ASD), UAV-HSI and satellite-based HSI are mapped into a unified spectral feature space, facilitating the integration of spatial and spectral characteristics. Finally, super-resolution networks, including enhanced super-resolution generative adversarial network (ESRGAN) and swin-transformer for image restoration (SwinIR), are employed to reconstruct high-quality satellite-based HSI. For comparison, this study employs a deep learning-based fusion network (infrared and visible image fusion via dual attention transformer, DATFuse) alongside a traditional fusion method (Gram—Schmidt, GS). The evaluation focuses on the spectral and spatial quality of wetland vegetation and water in the reconstructed and fused results derived from Sentinel-2 and OHS-02 images. This study highlights that (1) The CMIFM-based super-resolution network enhances the spatial resolution of satellite-based HSI by learning the spatial—spectral features of UAV-HSI. This approach effectively reconstructs fine spatial textures of wetland vegetation and water outperforming the traditional GS fusion method in both visual perception and quantitative metrics. Specifically, the reconstructed results of Sentinel-2 and OHS-02 imagery achieve average peak signal-to-noise ratio (PSNR) of 11.06 and structural similarity index measure (SSIM) of 0.3102, when compared with reference data. (2) The spectral features of three typical wetland vegetation communities (Cynodon dactylon, Cladium chinense Nees, and Miscanthus) and water in the reconstructed images exhibit high reliability. Specifically, the OHS-02 reconstructed imagery achieves an average band-wise RMSE of 0.1154 and an R² of 0.7239 when compared with ASD ground-measured data. (3) The CMIFM+ESRGAN and CMIFM+SwinIR methods provide strong generalization capabilities in spatial—spectral reconstruction. They could perform image reconstruction in similar wetland-type scenes even in the absence of UAV-HSI data, achieving average PSNR of 12.74 and SSIM of 0.1897. (4) This study verifies the feasibility of CMIFM-based super-resolution technology in hyperspectral reconstruction images of complex wetlands.关键词:karst wetland;CMIFM module;cross-platform super-resolution reconstruction;DATFuse fusion algorithm;hyperspectral images;quantitative evaluation of spatial-spectral reconstruction quality187|749|0更新时间:2025-09-30
 - “在城市地质灾害领域,北京平原区地面沉降研究取得新进展,采用ST-PCA方法揭示了地面沉降的趋势特征、波动特征及空间分布模式,为地面沉降防控提供数据支撑。”
 摘要:Land subsidence is a kind of geological hazard that occurs in many urban areas with long duration and wide influence. In the plain area of Beijing, land subsidence has been detected early and monitored over a long period. Analyzing its spatiotemporal evolution is essential for providing critical data support for the prevention and control of subsidence-related risks. However, traditional approaches to analyzing land subsidence often consider temporal or spatial aspects separately, which may discount hidden information and potential patterns within the data. Spatial and Temporal Principal Component Analysis (ST-PCA) is presented in the paper to identify the hidden spatiotemporal characteristics of land subsidence in the Beijing plain. Permanent Scatterer Interferometric Synthetic Aperture Radar (PS-InSAR) is a remote sensing technique to measure and monitor displacement of the earth’s surface. PS-InSAR is used in this paper to obtain long-term land subsidence information in Beijing Plain with Radarsat-2 SAR data. ST-PCA is a mathematical transformation method that converts a set of correlated variables into a set of uncorrelated new variables. It simplifies the complexity in high-dimensional data by spatiotemporal clustering. In the paper, ST-PCA is used to discover the spatiotemporal variations features of land subsidence in the Beijing Plain based on the land subsidence data from 2010 to 2016.ResultTime Principal Component Analysis (TPCA) can be used to determine the trend and fluctuation characteristics of land subsidence, along with the corresponding spatial distribution patterns. The eigenvalues derived from TPCA analysis determine the amount of information that is explained by each component. The first two principal components (variance contribution rate) express respectively the characteristics of land subsidence about 96.5% and 2.2% in research area. TPC1 reflects the general subsidence trend across the study area, exhibiting a spatially uneven pattern. TPC2 captures the seasonal variations and the spatial heterogeneity of subsidence, particularly highlighting significant seasonal differences between the northern and southern parts of the subsidence funnel area. In the northern region, subsidence is more severe in summer than in winter, while in the southern region, winter subsidence exceeds that of summer. Spatial Principal Component Analysis (SPCA) is a useful technique for understanding the temporal evolution patterns of land subsidence through clustering subsidence points with similar temporal trends into the same principal component. The first three principal components (variance contribution rate) explain a cumulative variance contribution rate of 90.3%. Specifically, SPC1, accounting for 76.3% of the variance, demonstrates the dominant feature of subsidence in most areas with a continuous linear decrease in land subsidence. SPC2 and SPC3, 13.0% and 1.0% contribution of the variance respectively, indicate that the average annual subsidence was close to zero, while significant seasonal fluctuation characteristics were found in the areas of slight subsidence and non-subsidence.关键词:ST-PCA;spatial and temporal evolution characteristics;land subsidence;PS-InSAR;Radarsat-2 data90|125|0更新时间:2025-09-30
 - “在遥感图像旋转目标检测领域,研究者改进YOLOv9检测器,开发了RSO-YOLO,综合检测精度达到81.1%平均精确率mAP,位居第一,兼顾速度和准确性。”
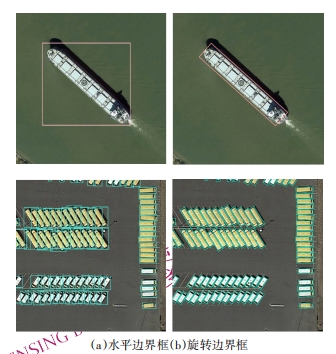 摘要:Rotated object detection is a fundamental task in the field of remote sensing, essential for accurately identifying and localizing objects with arbitrary orientations in aerial or satellite imagery. Existing algorithms often struggle with significant challenges such as large variations in target scales, dense distributions of targets leading to occlusions, confusion due to similar features, complex background interference, and insufficient image details.These issues often come with high computational burdens and limitations in detection accuracy. To address the challenges of rotated object detection in remote sensing images, this study improves upon the state-of-the-art YOLOv9 detector by developing a new high-performance rotated object detector that balances detection accuracy and inference speed. we employ a low-light remote sensing image auxiliary data enhancement module to improve issues related to poor lighting, noise, blurring, and contrast. Second, a decoupled angle prediction head is designed to enable the algorithm to perceive the orientation of remote sensing targets. Third, a Kalman filter-based intersection over union (IoU) loss is incorporated into the model to address the periodicity issue caused by rotating object representation, using distribution focal loss to predict angles and solve the angle representation problem for nearly square objects within Gaussian modeling methods. Fourth, a dynamic label assignment strategy for rotated object detection is proposed. This strategy considers IoU and score values during the assignment process and incorporates a distance penalty term, thereby constructing a sample space that effectively reflects the characteristics of the targets. Finally, during nonmaximum suppression, we use probabilistic IoU and merging rate based on the Hellinger distance to remove some redundant candidate boxes, thus reducing computational burden. We evaluated the proposed RSO-YOLO detector on the publicly available DIOR-R dataset. Experimental results show that our method achieved a mean average precision (mAP) of 81.1% on this dataset, surpassing several typical rotated object detection methods and achieving top rank in detection accuracy. Notably, the introduction of the auxiliary data enhancement module contributed to a 1.5% increase in mAP, demonstrating its effectiveness in enhancing detection performance under low-light and poor-quality imaging conditions. Moreover, we verified the model’s generalization ability on the DOTA dataset, where the results were also outstanding. In conclusion, RSO-YOLO strikes a balance between detection speed and accuracy, showcasing its engineering application potential in maritime and airport monitoring, urban management, disaster assessment, and agricultural and forestry inspections. It also provides reusable modular solutions for future research on rotated object detection under low-light and complex background conditions.关键词:deep learning;remote sensing object detection;rotated bounding boxes;data augmentation;rotated task alignment learning;two-dimensional gaussian distribution116|544|0更新时间:2025-09-30
 -
 摘要:Accurately extracting small wetlands over large areas is of great significance for enhancing the efficiency of wetland monitoring and conservation, as well as further promoting ecological civilization construction. From the perspective of phenology, this study first established a classification system for wetlands, including permanent water bodies, flooded herbaceous vegetation, flooded woody vegetation, seasonal inundation areas, and paddy fields, based on the characteristics of Synthetic Aperture Radar (SAR) images. It then constructed the time series of backscatter coefficients and coherence coefficients from Sentinel-1 VV and VH polarization modes. Subsequently, the MultiRocket-RF time series classification model was applied to extract wetlands on the basis of the scattering differences of radar beams from various land cover types during different phenological periods.In addition, by using 5 hm2 as an area threshold to divide small and large wetlands, this study proposed a morphological method to alleviate the problem of wetland patch adhesion and reduce the misclassification of small wetlands as large wetlands. Finally, considering the natural attribute of extensive wetlands and floodplains, as well as the social development characteristic of being committed to exploring new mechanisms for sustainable development, this work selected the Yangtze River Delta Ecological Green Integrated Development Demonstration Area as the study area and the entire year of 2021 as the sample period. By comparing the performance of the models across various data sources and different sizes of small wetlands, this study analyzed and verified the effectiveness of the proposed small wetland extraction method, which combines SAR time-series images with the MultiRocket-RF model.Results are as follows (1) The combination of SAR time-series data and MultiRocket-RF time series classification model could better adapt to the phenology-based wetland classification system in comparison with other methods and had excellent performance in extracting various types of wetlands. The overall accuracy reached 93.6%, the Kappa coefficient reached 0.888, and the macro-F1 score reached 0.804. The model was particularly advantageous for identifying flooded herbaceous vegetation, flooded woody vegetation, and seasonal submerged areas in small wetlands. (2) The problem of wetland patch adhesion could be effectively alleviated by applying moderate morphological dilation and erosion to sever small, narrow, and connected wetland patches, leading to an improvement in the accuracy of small wetland extraction. Although the Kappa coefficient did not change significantly, the macro-F1 score increased from 0.798 to 0.804, and the extraction accuracy for various small wetlands in the confusion matrix was generally great. (3) The model presented in this paper was suitable for extracting small wetlands larger than 1 hm2. However, owing to the speckle noise, geometric distortion, and other negative effects caused by the side-looking characteristics and imaging principles of SAR satellites, the performance in extracting wetlands smaller than 1 hm² was suboptimal, with a significant deviation from the true distribution.This study not only expanded the application fields of SAR data but also provided a new technical idea for the extraction of small wetlands, which contributes to further promoting the refined and holistic development of wetland ecological conservation and scientific management.关键词:remote sensing;phenology;small wetlands;backscatter coefficient;coherence coefficient;MultiRocket transformation;Random Forest171|340|0更新时间:2025-09-30
Models and Methods
- Postal code:100190
- Tel:010-58887052 Email:nrsb@aircas.ac.cn
- Technical support is provided by Beijing Founder electronics co., LTD 京ICP备20021838号-9
 京公网安备11010802024621
 - It is recommended to read the content of this site in Chrome&IE9+. Please switch to extreme mode in browser 360.
- Cookies We use cookies to help provide and enhance our service and tailor content. By continuing, you agree to the use of cookies.

0