
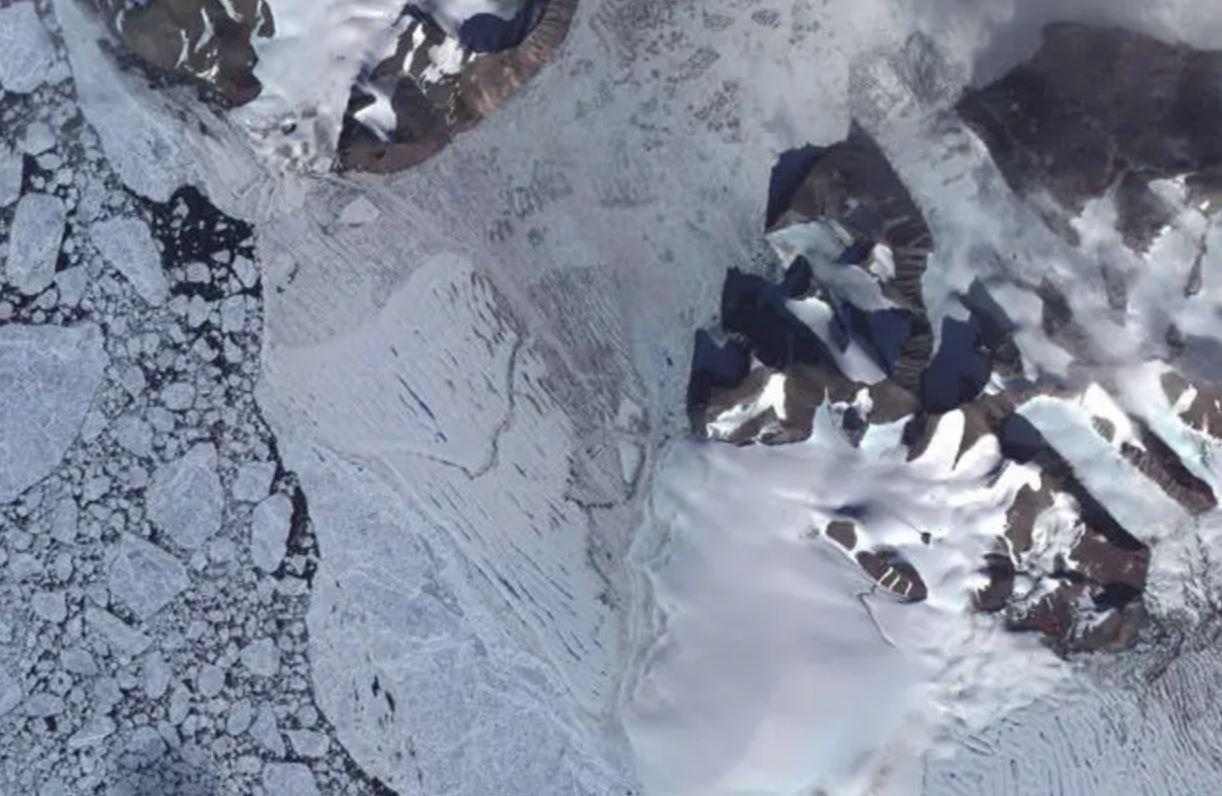
Cryosphere remote sensing
随着对地观测技术的飞速发展,冰冻圈遥感才取得了迅猛发展。特别是 21 世纪以来,新型、先进传感器的涌现,以及专门针对冰冻圈研究的卫星成功发射和运行,如 NASA 的 ICESAT 卫星和欧洲航天局 CryoSat 卫星,使冰冻圈遥感的发展生机勃勃。小编整理了《遥感学报》发表的冰冻圈遥感好文供您赏析!
- The Paper
- Abstract:Annual sea ice is an important indicator of climate change in mid-latitudes, especially the thin ice with a thickness of less than 10 cm has a more significant response to climate. The Bohai Sea, as a marine system with special research value in the temperate monsoon climate zone and even globally, shows a high degree of sensitivity in its natural ecological and socio-economic systems, and there is a significant bidirectional feedback effect between the sea ice dynamics and the regional climate and human activities. The Bohai Sea is affected by forty runoffs from the Yellow River, Liao River, and Hai River, and the concentration of Suspended Particulate Matter (SPM) in seawater is much higher than that in other sea areas, and the high dynamics of suspended sediment also leads to the complexity of the spectra of sea ice and seawater, which increases the difficulty of accurately detecting the extent of sea ice in the Bohai Sea.In this study, a segmented processing strategy was employed. Initially, sea ice with a thickness greater than 10 cm was extracted by means of a simple threshold segmentation method. Secondly, in order to address the challenges posed by the high spectral volatility of sea ice and the difficulty in detecting thin ice in the highly dynamic suspended sediment sea area of the Bohai Sea, this study proposes an adaptive partitioning method based on spectral shapes by deeply analysing the spectral characteristics of ice and water in this region. The method is predicated on the dynamic division of the Bohai Sea into regions characterised by low and high suspended particulate matter concentrations. Following this treatment, the spatial heterogeneity of SPM concentration in the region is significantly reduced, thereby effectively improving the detectability of thin ice with a thickness of less than 10 cm. Subsequently, an analysis was conducted on the four bands most commonly employed in optical images, with a view to ascertaining their degree of separability and identifying the preferred segmentation features. The analysis results demonstrate that the blue band and the near-infrared band are the most effective segmentation bands for low and high SPM concentration regions, respectively. The segmentation threshold is determined automatically based on the preferred features using the single-peak threshold method, and the image edge features are fused to enhance the robustness of the algorithm.The present method is applied to five optical images, MODIS, Sentinel-2, GF-1, Sentinel-3 and GOCI, and the accuracy is verified by using the 12 views of sea ice interpretation maps and sample points of high-resolution remote sensing images for the years 2017—2019 released by the North Sea Forecasting Centre of the Ministry of Natural Resources. The results show that the accuracy of this algorithm can reach more than 90% and is applicable to a variety of optical images; simulation experiments using the spectral linearity mixing model demonstrate that this algorithm is capable of identifying annual sea ice with densities of more than 30% in highly dynamic suspended sediment sea areas.This method can automatically, stably, efficiently and accurately extract annual sea ice, which can be applied to multi-source sensors, and also provides data support for researching climate change by giving full play to the advantages of multi-source remote sensing data for more comprehensive and fine sea ice monitoring.Keywords:Bohai sea;annual sea ice;multiple optical sensors;suspended particulate matter concentration;concave convex index;adaptive marine zoning;single-peak threshold method;automatic detection algorithm348|891|0
 <HTML><L-PDF><Enhanced-PDF><Meta-XML>Updated:2026-02-09
 - Abstract:The Antarctic coastline is highly sensitive to global environmental change and is undergoing rapid transformation because of global warming. The retreat of ice shelves has led to increased direct exposure of glaciers to the ocean, forming iceclifftype coastlines that terminate at grounded glaciers. These coastlines are key zones for studying ice sheet instability, and accurate monitoring of their changes is crucial for predicting future sea level rise. However, compared with iceshelf-type coastlines, ice cliff coastlines, with their complex and subtle variations, present considerable challenges, and high-precision extraction algorithms still require further development. This study proposes a dual-boundary fusion algorithm on the basis of the topological closure relationship between threshold- and edge-derived boundaries, enabling the high-precision extraction of continuous coastlines. An automatic error self-assessment method on the basis of different boundary connectivity features is introduced. With typical regions on the Antarctic Peninsula as examples, Sentinel-1 SAR data with 15 m resolution are used to extract ice cliff coastlines. The performance of the dual-boundary fusion algorithm is validated through full-sample assessment across three types of ice cliff coastline interfaces, namely, ice cliff-seawater (sea ice), ice cliff shadow-seawater (sea ice), and ice cliff-mélange. Results show that the proposed algorithm can accurately and automatically extract the first two types of ice cliff coastlines, which account for 92% of the total ice cliff coastline length in the study area. For the ice cliff-sea water (sea ice) interface, the mean error is 0.31 ± 1.13 pixels (at 15 m resolution), with 85.8% of the coastline having zero-pixel error. For the ice cliff shadow-seawater (sea ice) interface, the mean error is 0.56 ± 1.55 pixels, and 74.9% of the coastline has zero-pixel error. By contrast, for the ice cliff-mélange interface, 83.8% of the coastline has an error exceeding 20 pixels in an unsupervised setting; however, the algorithm can automatically identify these large low-accuracy regions for subsequent refinement. The dual-boundary fusion algorithm effectively addresses the accuracy limitations of threshold segmentation and the noise sensitivity of edge detection without requiring training samples. It is computationally efficient and suitable for long-term, high-precision monitoring of most ice cliff coastlines across Antarctica.Keywords:Antarctic icecliff coastline;automatic coastline extraction;dual-boundary fusion algorithm;threshold segmentation;edge detection;Sentinel-1 SAR GRD data432|1319|0<HTML><L-PDF><Enhanced-PDF><Meta-XML>Updated:2026-02-09
- Abstract:Periglacial landforms are distinctive surface features shaped by frost weathering and freeze-thaw cycles, and they are commonly found in the permafrost regions of the cold periglacial zones on the Tibetan Plateau. Changes in these landforms serve as key indicators of climate change on the plateau and are substantial contributors to geological hazards, such as permafrost landslides, in periglacial environments. Rock glacier and talus are typical types of periglacial landforms. Studying the spatiotemporal deformation characteristics of periglacial landforms is crucial for understanding the physical mechanisms and dynamic processes of their deformation, identifying potential geological hazard risks, and enhancing the ability to prevent secondary disasters. In early 2022, China successfully launched a high-resolution L-band differential interferometric SAR (LT-1) satellite constellation, with surface deformation monitoring as its core mission. This satellite is a new source of data with high spatiotemporal resolution for research on periglacial landform deformation. This study focused on deformation detection of two typical periglacial landforms (rock glaciers and talus) developed in the Nyainqêntanglha mountains on the Tibetan Plateau and used newly acquired ascending and descending LT-1 SAR data. An inventory of rock glaciers and talus was compiled using high-resolution optical imagery from Gaofen-2 (GF-2) and Gaofen-7 (GF-7) satellites, and 1,094 rock glaciers and 148 talus slopes were identified. A total of 15 ascending and 10 descending scenes of 3-meter-resolution Stripmap1-mode data from the LT-1 SAR satellite constellation, acquired between July 2023 and August 2024, were used for the analysis. Surface deformation across the study area was detected using stacking-InSAR and multitemporal InSAR (MT-InSAR) methods. Then, the actively moving areas within the identified rock glaciers and talus were delineated on the basis of the stacking InSAR and MT-InSAR deformation results. Comparative deformation analysis using Sentinel-1A data from the same period as LT-1 was conducted to validate the deformation results acquired by LT-1 SAR. The deformation interpretation results acquired by LT-1 from stacking-InSAR show that 83% of the rock glaciers in the study area are active, and 80.8% of the taluses exhibit active regions. The MT-InSAR results indicate that 77.8% of the rock glaciers are active, and 72% of the taluses contain active regions. The active regions extracted by stacking-InSAR and MT-InSAR show fine consistency. The annual cumulative deformation of rock glaciers within the study area ranges from 0.06 m to 0.16 m, and that of taluses ranges from 0.01 m to 0.09 m, indicating that taluses are less active than rock glaciers. The temporal movement of both landforms exhibits heterogeneity characterized primarily by seasonal variation, with high movement rates in summer and stability in winter. The research findings indicate that the deformation results obtained from LT-1 are consistent with those derived from Sentinel-1A data, demonstrating the accuracy of the LT-1 satellite results. The LT-1 satellite demonstrates fine application capabilities in complex periglacial environments, effectively extracting the spatiotemporal deformation of rock glaciers and taluses. Stacking InSAR can effectively, accurately, and quickly identify active areas of rock glaciers and taluses, allowing for the assessment of their activity. The MT-InSAR method can provide accurate quantitative analysis of the deformation time series for rock glaciers and taluses.Keywords:Rock glacier;Talus;LT-1;MT-InSAR;deformation monitoring;Tibetan Plateau509|2806|0<HTML><L-PDF><Enhanced-PDF><Meta-XML>Updated:2026-02-09
- Abstract:High spatial and temporal resolution snow cover remote sensing range data are the key driving data for hydrological simulation. The accuracy of snow cover range directly determines the reliability of simulation results. Existing snow range remote sensing products, limited by sensor performance, often cannot achieve high temporal and spatial resolution and are stretched when facing highly spatially heterogeneous patchy snow distribution. As an important driving data for hydrological simulation, daily snow cover extent data with a spatial resolution of 30 m is crucial to improving the accuracy of basin-scale hydrological simulation. The purpose of this study is to prepare 30 m daily high-precision snow coverage data in the Qilian Mountains, in order to achieve dynamic monitoring of spatiotemporal changes in snow cover area.This study used the U-Net++ deep learning network to predict the snow cover range with high spatiotemporal resolution. First, the Landsat 8 SR reflectance data at the previous time t1 and the MOD09GA reflectance at t1 and t2 were resampled, and the pixels were matched.
- Abstract:Each summer, proglacial river networks develop in northern Greenland and can route large volumes of surface meltwater into the ocean, acting as important meltwater connections between the ice sheet and the ocean. However, the spatial distribution and geomorphology of the proglacial river networks in northern Greenland remain unclear. On the basis of 10 m resolution Sentinel-2 satellite images and 30 m resolution Copernicus DEM, this study maps proglacial water on the northern Greenland (with an area of 100,132 km2) in 2020 using an automatic water remote sensing information extraction algorithm constrained by routing.First, river features are enhanced from the image background by using a modified normalized difference water index, a Gabor filter, and a path opening operator. Second, the Area Of Interest (AOI) for rivers is constructed to reduce the interference of bare ground and shadow features by combining the height above the nearest drainage AOI and topographic depressions. Third, the derived water mask is interested with DEM-modeled drainage networks to delete pseudo drainage channels, to generate continuous, realistic drainage networks, and to classify proglacial river networks and isolated lakes on the basis of their morphometric characteristics. Finally, proglacial river networks are connected by using continuous DEM-modeled drainage networks to produce the dataset of 10 m resolution continuous proglacial river networks and isolated lakes.Our mapping results show the spatial distribution of proglacial river networks, compare four water remote sensing datasets (Dynamic World V1, CALC-2020, Esri Land Cover, and ESA WorldCover), and quantitatively analyze the length, width, area, drainage density, and order of river networks. Our results indicate the following: (1) This study accurately extracts and divides remote sensing information of the proglacial river networks and isolated lakes, and the overall accuracy of river network remote sensing information extraction is 93%±2%, which is better than the four comparison datasets (overall accuracy of 83%—89%). Our results can accurately reflect the spatial distribution of the proglacial river networks in the study area, especially small rivers during the melting period. (2) In 2020, a total of 995 proglacial river networks, covering a total water area of 1832.6 km², developed in northern Greenland and could route 90.5% of total surface meltwater runoff into the ocean. (3) Proglacial river networks have considerable network order difference ranging from 1 to 5. Order 1—2 river networks account for over 84% river networks, whereas the limited number of 40 (<5%) order 4—5 high-order river networks dominate the length of river networks (52.9%), water area (63.9%), catchment area (54.1%), and the routing of surface meltwater runoff (69.3%).This study produces a high-resolution proglacial water dataset with large spatial coverage, making up for the lack of precision of the existing datasets, and shows the overall distribution of the large-scale proglacial river networks. Our findings reveal that the widely distributed proglacial river networks in northern Greenland are dominated by high-order river networks and substantially route surface meltwater, thereby improving our understanding of meltwater routing from the supraglacial to proglacial regions in northern Greenland.Keywords:proglacial rivers;proglacial lakes;river networks;river network order;Greenland ice sheet;Remote sensing dataset;DEM drainage network;river and lake classification;accuracy verification756|2062|0<HTML><L-PDF><Enhanced-PDF><Meta-XML>Updated:2026-01-05
- Abstract:Sea ice represents a typical natural phenomenon that affects the marine and coastal environment in North China; thus, it is the focus of marine environment monitoring. Timely and accurate remote sensing data about sea ice is crucial for emergency treatment and recovery. Various remote sensing technologies have been applied to sea ice monitoring, with Sea Ice Concentration (SIC) serving as a key parameter indicating the spatial distribution characteristics of sea ice. Among these, optical remote sensing is frequently used. However, sea ice and different types of clouds (i.e., cirrus and cumulus) have similar reflection characteristics in Visible and Near-Infrared (VNIR) wavelengths, thus posing great difficulties for the optical extraction of sea ice. Haiyang-1C/D (HY-1C/D) satellites are the first operational ocean color satellites of China, and both of them are equipped with a Coastal Zone Imager (CZI) and the Chinese Ocean Color and Temperature Scanner (COCTS), which can technically support the fine and dynamical monitoring of sea ice due to their wide coverage and high spatiotemporal resolution. In addition to the VNIR bands (412—865 nm), the onboard COCTS sensor can interpret the thermal characteristics of targets, which would help distinguish between sea ice and clouds. In this study, Liaodong Bay of the Bohai Sea is selected as the study area, and synchronous CZI and COCTS images covering Liaodong Bay from December 2021 to March 2022 are collected and analyzed. The main objective of this study is to verify the feasibility of HY-1C/D satellites to detect sea ice, especially the image characteristics of typical targets (i.e., sea ice, seawater and clouds) in optical (i.e., VNIR) and thermal infrared bands. Using the Brightness Temperature (BT) difference between sea ice and cloud in the thermal infrared band of COCTS, sea ice and cirrus clouds can be preliminarily separated. However, the difference in BT between sea ice and cumulus clouds is minimal, which can be further separated in accordance with the NIR-red reflectance ratio. In addition to the sea ice identification, the application of SIC can effectively unmix ice-water pixels and improve the estimation accuracy of the sea ice coverage area for optical images with different spatial resolutions. The above results can confirm the capability of HY-1C/D satellites in sea ice detection. Therefore, HY-1C/D satellites can provide reliable data and improve the monitoring of sea ice.Keywords:HY-1C/D satellites;sea ice;spectral features;brightness temperature;cloud detection;Sea Ice Concentration (SIC)488|1702|0<HTML><L-PDF><Enhanced-PDF><Meta-XML>Updated:2026-01-05
- Abstract:Lakes, known as “sentinels” of global climate change, are key contributors to the worldwide water cycle. Accurately estimating lake water storage and its fluctuations is crucial to forecasting global climate change. The Surface Water and Ocean Topography (SWOT) mission, launched in December 2022, offers comprehensive observations of the world’s lakes, providing a major advancement in our understanding of lakes on a global scale. To utilize SWOT data in the future, this study conducts simulations and evaluates the application potential in lake storage estimation of SWOT mission. We generate SWOT lake data, estimate the simulated water storage of four lakes located on the Qinghai-Tibet Plateau, analyze the errors of lake water storage derived from SWOT simulation data, and suggest necessary considerations for future use of SWOT mission in estimating lake water storage. By addressing these issues, we hope to offer valuable insights for more accurate utilization of SWOT data in estimating lake water storage in the future.In this experiment, we employed the CNES SWOT hydrology toolbox to generate simulated data of lakes. The toolbox contains three primary components: large-scale simulator, RiverObs, and LOCNES. The tool computes the lake extent data intersected by the SWOT wide swath. Subsequently, the tool generates point cloud data within the overlapping area. Each point cloud dataset contains detailed information, including the water surface height. Next, the RiverObs tool was employed to create SWOT river data in shapefile format. Finally, the LOCNES tool was used to generate lake data from the data not categorized as part of the river system.The National Tibetan Plateau Scientific Data Center (TPDC) provides bathymetry point data for four lakes. This study uses Topo to Raster in ArcGIS to generate the lake bathymetry. In addition, this study uses the global lake bathymetry GloBathy. We used the true maximum depth data of four lakes provided by the TPDC to regenerate modified GloBathy data. In summary, this experiment obtained three sets of lake bathymetry data of four lakes, including true bathymetry (tru), initial GloBathy (ori), and modified GloBathy (mod).Last, this study used the SWOT-simulated data to estimate the lake water storage. We analyzed the effect of errors in SWOT mission on lake storage estimation. In the SWOT PIXC data, the errors of majority of water surface elevation measurements are less than 1 m. After averaging at the scale of the lakes, the errors were mostly within 0.02 m. The error of the water surface height measured by most SWOT point clouds was less than 1 m. The correlation coefficient between the simulated water surface height sequence of the SWOT mission and the real sequence exceeded 0.9, indicating that the SWOT mission can well reflect the seasonal changes in the lake water surface height. The relative error in estimating lake area from SWOT observations was less than 10% due to the dark water effect. In this study, SWOT-simulated data were used to estimate lake water storage using three types of lake bathymetry. It showed that the errors in water surface elevation had a relatively small effect on the accuracy of lake water volume estimation, while the errors in estimating the lake topography had a more considerable effect on the accuracy of lake water volume estimation.The research indicates that the SWOT mission has remarkable prospects for lake water volume estimation. Obtaining higher-precision prior data on lake depths is critical for improving accuracy in lake water storage estimation in the future. In the future, we can combine SWOT mission data with other hydrological satellite data and surface measurement data to obtain more accurate water storage changes in surface water.Keywords:Tibetan Plateau;Surface Water and Ocean Topography (SWOT);CNES hydrology simulator;lake area;lake water storage;lake bathymetry1267|2993|0<HTML><L-PDF><Enhanced-PDF><Meta-XML>Updated:2026-01-05
- Abstract:Hail has occurred frequently and caused significant losses to local agricultural production in Honghe Prefecture, Yunnan Province, since 1961. Hail disaster distribution data at the county or weather station scale, which are obtained by using a statistical analysis method, cannot meet the requirements of agricultural hail prevention. Several hail disaster remote sensing monitoring methods, which are limited by single remote sensing data sources and the characteristics of designing for the global scale, lack applicability in mountainous areas. To capture the spatial and temporal distribution characteristics of hail and build a hail remote sensing monitoring model at the parcel level, this study used hail record data from hail suppression operation stations from 2009 to 2022 and conducted research on a multisource data fusion approach based on Ross Li and STARFM. It then proposed a multilevel grid normalized vegetation index standardization model and a hail remote sensing monitoring recognition index RNDVI_M. The Kneed method was used to extract the trend turning points of RNDVI_M as the threshold for extracting hail disaster areas. Then, the phenomenon universality verification method was applied to verify the effectiveness of the RNDVI_M threshold and evaluate the accuracy of hail monitoring. On the basis of hail survey data from 2009 to 2022, the maximum relative error is 9.08%, the average error is 5.62%, and the standard deviation is 1.66%. The spatial overlay analysis and spatial correlation analysis methods were used to quantitative analyzed hail frequency in different disaster-prone environments, such as landform types, terrain undulations, slopes, and terrain types, at the level of cultivated land plots. The proposed hail disaster risk assessment model calculates the spatial distribution characteristics of hail risk caused by natural conditions, such as climate, meteorology, terrain, and topography. Hail disasters in mountainous areas are significantly correlated with altitude and exhibit moderate correlation with slope and undulation. Hailstones typically move along mountain ranges and valleys, making farmlands along these valleys susceptible to hail disasters.The advantages of this model are as follows. (1) Parameter adaptation for multilevel grid models is used to improve model adaptability under 3D climate conditions of mountainous areas, increasing the accuracy of hail monitoring and risk assessment from county scale to cultivated land plot scale. (2) Spatial correlation quantitative analysis is conducted between the spatial distribution of hail disasters and terrain, such as altitude, slope, undulation, river valleys, valleys, and ridges at the scale of cultivated land plots. (3) The hail susceptibility assessment model is constructed at the cultivated land plot scale. Research results contribute to the rational adjustment of the crop planting structure, the planning and layout of artificial hail control operation points, and the reduction of hail disaster losses.Keywords:Hail disaster;hail remote sensing identification index (
R NDVI_M);Hail Disasters Remote Sensing Monitoring;Temporal and spatial distribution of hail disasters;Honghe2694|2588|0<HTML><L-PDF><Enhanced-PDF><Meta-XML>Updated:2024-12-30 - Abstract:High Mountain Asia (HMA) is the richest high altitude region in the world except for the poles in terms of glacier and snow resources, The accurate monitoring of HMA snowpack distribution is important for HMA snowmelt runoff simulation, climate change prediction and ecosystem evolution. Fractional Snow Cover (FSC) can quantitatively describe the extent of snow cover at the sub-image scale, and is more suitable for reflecting the distribution of snow in complex mountainous areas than binary snow. The objective of this study is to develop a new HMA snow area ratio inversion algorithm and integrate the algorithm into Google Earth Engine to prepare a set of long time series HMA snow area ratio products.Considering the influence of HMA topography and sub-bedding type on the accuracy of snow accumulation information extraction, this paper proposes a Multivariate Adaptive Regression Splines (MARS) model LC-MARS to invert the proportion of snow accumulation area in Asia by integrating topography correction and subland class feature extraction. The FSC extracted by Landsat 8 is used as the true value, and the LC-MARS model is tested for inversion FSC accuracy using binary and error validation methods, and the performance of linear regression models trained with the same training samples and the LC-MARS model for inversion HMAFSC accuracy is compared, and the accuracy of the FSC inversion of the LC-MARS model with SnowCCI and MOD10A1 is also compared.(1) The overall accuracy of FSC binary validation of LC-MARS model inversion showed that Accuracy and Recall were 93.4% and 97.1%, respectively, and the overall accuracy of error validation showed that RMSE was 0.148 and MAE was 0.093, both binary validation and error validation indicated that the FSC accuracy of LC-MARS model inversion was higher. (2) The LC-MARS model trained based on the same training samples has higher FSC accuracy than the linear regression model in forest area, vegetation and bare land inversions, indicating that the LC-MARS model is more suitable for FSC inversions in mountain and forest areas. (3) The overall RMSE of MOD10A1 is 0.178 and MAE is 0.096; the overall RMSE of SnowCCI is 0.247 and MAE is 0.131. The accuracy of FSC prepared by LC-MARS is higher than that of MOD10A1 and SnowCCI, indicating that FSC inversion by LC-MARS has some application value.The LC-MARS model can fit high-dimensional nonlinear relationships and significantly improve the inversion accuracy of FSC in mountain and forest areas. The computational efficiency of the LC-MARS model based on Google Earth Engine is high, and it is suitable for preparing FSC products of large scale long time series. In this study, the day-by-day MODIS FSC products of HMA from 2000 to 2021 were prepared based on the LC-MARS model, which provides important data support for the study of climate change, hydrological and water resources in HMA.Keywords:remote sensing;High Mountain Asia (HMA);Fractional snow cover;MODIS;MARS;Terrain correction603|2516|2<HTML><L-PDF><Enhanced-PDF><Meta-XML>Updated:2024-11-06
- Abstract:In recent years, with the development of Global Navigation Satellite Systems (GNSS), a GNSS-multipath reflectometry (GNSS-MR) technique based on Signal-to-Noise Ratio (SNR) has been developed. This technology can obtain the information of the reflector by using a GNSS receiver and has the advantages of abundant signal sources and high sampling rate in snow depth inversion. However, many GNSS receivers do not record SNR observations. Thus, a multimode and multifrequency GNSS-MR snow depth inversion fusion method based on Signal Strength Indicator (SSI) is proposed in this study to make these receivers capable of snow depth monitoring. At the same time, aiming at the two main problems existing in GNSS-MR inversion of snow depth, that is, low precision and low time resolution, this method can also be effectively solved. This approach mainly benefits from the strategy of performing a robust estimation. The specific steps are as follows: first, by using SSI and SNR data of GPS, GLONASS, Galileo and Beidou, and using Lomb-Scargle Periodogram (LSP) method in classical snow depth retrieval principle, the snow depth retrieval values of each frequency band are obtained from four constellations. Then, a specific time window is established, and the state transition equation set is established in each time window considering the snow surface dynamic change and tropospheric delay. Finally, the snow depth time series is solved by a robust estimation model. In essence, it is a method of optimal valuation for GNSS-MR that is theoretically suitable for different geographical environments. In addition, this study selected a suitable station for snow depth retrieval experiments to prove the feasibility and effectiveness of the method. The experimental station is SG27 in Alaska, United States.Results show that the multifrequency SSI data of four global satellite systems can retrieve snow depth. Before multimode and multifrequency GNSS-MR snow depth inversion fusion, the results of SSI inversion at each frequency band have good correlation with the measured snow depth (except for Beidou frequency band, the other correlation coefficients is greater than 0.92). Considering the standard deviation and root mean square error of the retrieval results of different satellite systems, the retrieval results of GPS satellite system are the best, followed by GLONASS, then Galileo. However, the retrieval results of these three satellite systems are similar. The Beidou satellite system has the worst retrieval result. Among the four satellite systems, root mean square error of the frequency band with the best inversion result is 6.34 cm. After multimode and multifrequency GNSS-MR snow depth inversion fusion, the root mean square error between the SSI inversion results and the measured snow depth series is 2.36 cm, and the correlation coefficient is 0.98. At the same time, the multimode and multifrequency GNSS-MR snow depth inversion based on SNR data is also performed in the calculation example; the results of SSI inversion are consistent with those of SNR inversion, and the feasibility and effectiveness of multimode and multifrequency GNSS-MR snow depth inversion fusion based on SSI are verified by experiments.Keywords:GNSS-MR;multi-mode and multi-frequency;snow depth;robust estimation;signal strength729|3888|2<HTML><L-PDF><Enhanced-PDF><Meta-XML>Updated:2024-11-06


