
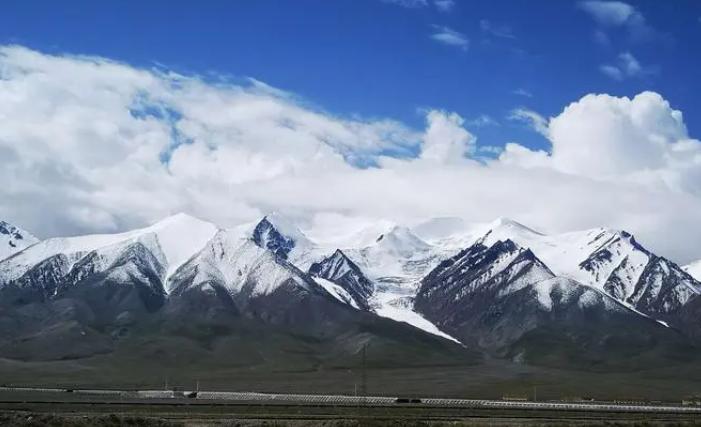
青藏高原遥感监测
Theme Keywords: Tibetan Plateauremote sensinglake levelwetland classificationwater level monitoringvolumesoil freeze/thawseasonal threshold algorithmsatellite altimetrysatellite
- The Paper
- Abstract:Lake ice is not only an important part of the cryosphere but also one of the most direct indicators of global climate change. In the context of climate warming and intensified human activities, global lake ice presents a trend of delayed freeze onset date, advanced break onset date, shortened ice cover duration, and thinning ice thickness. This trend tends to last for a long time. Consequently, a series of chain reactions of lake physical hydrology, hydrochemistry, and ecosystem will inevitably be triggered, further heaving the burden of natural environment and habitat construction. Therefore, it is necessary to perform fine-scale monitoring and scientific analysis of spatiotemporal patterns on lake ice variations for further predicting the early warning of global climate change. Toward overcoming the limitation of in-situ surveys, remote sensing technique comes to play a significant role in lake ice monitoring, which can provide large-scale, long time series, and high temporal resolution data for lake ice research. Previous efforts always focus on lake ice and its response to climate change using different remote sensing sensors, parameters, and characteristics. Through reviewing pioneering research, this study presents a general review on the remote sensing data source and methods for lake ice studies as well as spatial and temporal variations of lake ice in global hotspots. This paper first reviews the development of the commonly used remote sensing data sources for lake ice monitoring, which include spaceborne and airborne remote sensing platforms and existing lake ice data products. Then, the methods of lake ice identification and retrieval of lake ice phenology and ice thickness parameters are compared and discussed. Threshold and index-based methods are commonly used in lake ice research. According to the previous studies, this review likewise summaries the research hotspots of lake ice and analyzes the spatial and temporal characteristics of lake ice variations. The research hotspots are mostly distributed in the Northern hemisphere, especially in Northern Europe, North America, and the Tibetan Plateau. In addition, influencing factors of lake ice variations, including climate factors and lake shape attributes, are discussed in this study. Finally, future development directions of lake ice study by remote sensing are discussed as follows: (1) to fully integrate multiple satellite data at medium and high spatial resolution to improve the accuracy of lake ice observations, particularly for small- and medium-sized lakes; (2) to reconstruct the long time series of lake ice phenology and thickness information and predict their future changes based on techniques such as big earth data and machine learning methods; and (3) to focus more on the research of past, present, and future of lake ice variation characteristics in the Tibetan Plateau, which is rather sensitive to climate change and remains largely unexplained. Remote sensing is an effective tool to monitor the variations of lake ice, yet what we should do imperatively is to advance the scientific understanding on climate change impacts and take immediate actions.Keywords:lake ice;Lake ice phenology;ice thickness;remote sensing monitoring;climate change1969|6768|2
 <HTML><L-PDF><Enhanced-PDF><Meta-XML>Updated:2024-10-30
 - Abstract:Glacier identification is important for monitoring water resources and climate change in surrounding areas. Although optical images have achieved high accuracy in glacier boundary identification, optical images are affected by cloud cover, and reproducing information under the clouds is difficult. Fully polarized SAR images contain rich features, and deep learning can fully exploit image information. Therefore, using fully polarized SAR images combined with deep learning can compensate for the lack of optical images and obtain accurate glacier recognition results. In this paper, VGG16-unet (VGG16 combined with U-net) is used to identify glaciers based on ALOS2-PALSAR fully polarized images of the western part of the Himalayas. The features include the diagonal elements of the polarization coherence matrix, Freeman-Durden, H/A/α, Pauli, VanZyl, and Yamaguchi polarization decomposition parameters totaling 19 features. To make full use of the image information, these features are analyzed and combined, and the glacier recognition accuracies are compared to select the best features. Given evident differences between glacier and nonglacier topography, elevation, slope, and local incidence angle are combined with polarization features as auxiliary features.Comparing the classification accuracy of different polarization features reveals the accuracy of Pauli, Freeman-Durden, VanZyl, and Yamaguchi features based on physical characteristics is higher, among which Pauli features have the highest accuracy with an Overall Accuracy (OA) of 92.54% and an average user intersection ratio (mIoU) of 78.78%. The OA is improved to 94.34%, and the mIoU is improved to 82.35% after adding the topographic data. In order to improve the recognition accuracy of glaciers further, a feature cross-combination approach is proposed, and results show the OA of the combination reaches 94.98%, and the mIoU reaches 85.67%, which are 0.64% and 3.32% higher than the classification accuracy of Pauli features, respectively.Selecting the best feature combination method and combining with deep learning plays an important role in improving the accuracy of glacier recognition, and the use of neural networks combined with fully polarized SAR images can effectively compensate for the shortcomings of optical images in glacier boundary identification.Keywords:remote sensing;glaciers;ALOS2-PALSAR;polarimetric decomposition;image segmentation;deep learning;Himalayas2104|3001|5<HTML><L-PDF><Enhanced-PDF><Meta-XML>Updated:2026-04-08
- Abstract:As a sensitive indicator of climate change, the glacial mass balance is of great relevance to regional water resource management, glacier disaster prevention and control, and global sea-level change prediction. With the intensification of global warming, the melting of glaciers in the western Qilian Mountains has accelerated since 2000. However, in recent years, not much is known about the interannual mass balance changes in this area, especially in Laohugou Number 12 glacier.In this paper, worldview optical stereo mapping, SRTM, and TanDEM-X bistatic InSAR are used to generate multisource DEM data, and the DEM difference method is used to obtain the interannual ice thickness change rate of the western Qilian Mountains from 2013 to 2014 and 2014 to 2015, and the average ice thickness change rate from 2000 to 2015. Results of the glacier mass balance for the corresponding period are obtained. On this basis, taking Laohugou Glacier Number 12 as an example, the glacier mass balance change rate during the three periods of 2013—2014, 2014—2015, and 2000—2015 is estimated, and the impact of precipitation and temperature changes on the mass balance changes are analyzed.The results show the ice thickness change rates of the western Qilian Mountains from 2013 to 2014 and 2014 to 2015 were -0.35 ± 0.034 m and -0.028±0.004 m, respectively, and the mass balance change rates were -0.27 ± 0.014 m w.e./year and -0.024 ± 0.084 m w.e./year, respectively. The average mass balance of Laohugou Number 12 Glacier from 2000 to 2015 was -0.013 ± 0.02m w.e./year, and the glacier was in a state of melting. The glacier loss rate slowed down from -0.33 ± 0.04 m w.e./year in 2013—2014 to -0.036 ± 0.09 m w.e./year in 2014—2015, which was mainly related to the increase in precipitation in 2015.This paper verifies the feasibility of high-quality optical stereo mapping satellite DEM data in solving the interannual mass balance problem of mountain glaciers.Keywords:remote sensing;WorldView DEM;TanDEM-X DEM;Laohugou No. 12 Glacier;Mass balance;InSAR;Qilian Mountains1154|2148|3<HTML><L-PDF><Enhanced-PDF><Meta-XML>Updated:2026-04-08
- Abstract:Rivers are integral to the water cycle, underpinning human development, ecological health, and regional climate stability. Recently, global warming, glacial melt, and recurring hydrological disasters have intensified disturbances in river systems, necessitating broad-scale monitoring of complex hydrological changes. While traditional field measurements are valuable, limitations in their spatial and temporal coverage call for alternative approaches. With the advancement of sensor technology and the proliferation of satellite platforms, (satellite) remote sensing has emerged as a pivotal method for contemporary river hydrology monitoring. Compared with hydrological field measurements, it offers remarkable advantages in terms of real-time data acquisition, vast spatial coverage, and reduced economic costs. Various remote sensing monitoring techniques have been extensively applied to monitor river characteristics, such as area/width, water level fluctuations, runoff estimation, and forming diverse-scale remote sensing products of hydrological elements. This study reviews various monitoring techniques for river hydrological variables using optical or radar imaging and satellite altimetry. It analyzes the latest research progress in the hydrologic variables, encompassing river width, water area, water level, runoff, and their changes. Additionally, the spatial scale and feasibility of previous literature are thoroughly discussed. The Tibetan Plateau, known as the “Roof of the World,” is one of the regions with a serious shortage of in situ hydrological monitoring data, despite being the source of major rivers in Asia. The application of remote sensing technology for river hydrological monitoring on the Tibetan Plateau encounters challenges in data sharing, pronounced spatial and temporal heterogeneity of hydrological processes, and intricate response characteristics to a warming and humidification climate.This study begins by examining the main satellite remote sensing data sources and methods used to monitor various hydrological elements of rivers. It summarizes the current research progress in river hydrology monitoring using remote sensing technologies and explores future development opportunities. The review also addresses the advancements and challenges of hydrological remote sensing techniques specifically applied to river monitoring on the Tibetan Plateau. Several persistent issues in river hydrological remote sensing development have been identified: (1) The accuracy of extracting river area and width in regions with complex topography is severely affected by mixed pixels and spectral similarities. (2) In areas with sparse or no hydrological stations, assessing remote sensing data’s quality and potential applications remains challenging. (3) Comprehensive monitoring and studies on the spatial and temporal patterns of hydrological changes in the inland flow areas of the Tibetan Plateau are lacking. Future research directions for remote sensing of river hydrology are outlined as follows: (1) Multisource remote sensing data must be integrated, and the technologies and their applications must be enhanced for hydrological monitoring. (2) Universally applicable remote sensing algorithms for river hydrology must be optimized for innovation. These priorities aim to address the critical challenges in hydrological remote sensing and enhance the capability and accuracy of monitoring systems, particularly in complex and underserved regions, such as the Tibetan Plateau. This study aims to promote the deepening of river hydrology research on the Tibetan Plateau region, providing more accurate and scientific–technical support for practical water resource management and policy-making.Keywords:River;Hydrology;remote sensing;Tibetan Plateau;water extent;water level;runoff1782|6337|2<HTML><L-PDF><Enhanced-PDF><Meta-XML>Updated:2024-11-27
- Abstract:Alpine wetlands are an important surface cover type on the Qinghai―Tibet Plateau because they play a key role in water conservation, climate regulation, and biodiversity maintenance. Accurate and timely knowledge of the temporal and spatial distribution of alpine wetlands is necessary for wetland protection and management. The selection of remote sensing classification features is crucial in wetland mapping. Although spectral, texture, and topographic features have been investigated, studies focusing on spectral index features and their mathematical statistical features and feature selection methods are limited. This study aims to classify alpine wetlands from the aspects of mathematical statistical features, alpine wetland types, feature selection methods, and selected feature sets combined with random forest classification algorithm using Sentinel-2 image data and taking the Shouqu Alpine Wetland Reserve as the research site. An in-depth and comprehensive analysis on the spectral index characteristics of alpine wetlands is performed to optimize the classification characteristics of alpine wetlands.The Gansu Shouqu Alpine Wetland Reserve was used as the research area, and classification characteristics (spectrum, vegetation index, red edge index, and water body index) were obtained on the basis of Sentinel-2 data. Filter and wrapper feature selection methods, including Jeffries–Matusita distance, Spectral Angular Distance (SAD), Euclidean Distance (ED), RF-RFE algorithm, and Relief-F algorithm are utilized to optimize these features. Meanwhile, Z test is applied for quantitative evaluation.The following conclusions can be drawn from this study. (1) Among the categories of alpine wetlands involved in the classification, rivers and bare land are the easiest to distinguish, followed by grasslands and swamps and then swampy meadows and meadows. MCARI2, NDWI, DVI, EVI, EWI, IRECI, MCARI, TCARI, and UGWI indices can be used to differentiate among adjacent swamps, swampy meadows, meadows, and grasslands. (2) The order of contribution of different index characteristics to wetland information extraction in terms of degree is water body index characteristics > vegetation index characteristics > red edge index characteristics. (3) ED and Relief-F algorithms in the filter method demonstrate excellent performance from the perspective of feature optimization methods. (4) A suitable alpine wetland information extraction method is selected using the indices RDVI, NDVI, MSR, RVI, VIgreen, RNDWI, NDWI, NDWI_B, MNDWI, EWI, and CIre. (5) The mathematical statistics of different classification features indicated that the median feature obtains the best classification result, followed by the average value feature.We provide detailed results from feature optimization methods, wetland classification optimization index, statistical feature evaluation, and categories involved in alpine wetland classification using multi-dimensional analysis. To the best of our knowledge, this study provides a novel transferable and universal method for the selection of characteristic variables for wetland information extraction.Keywords:remote sensing;wetland classification;alpine wetland;feature selection;Qinghai-Tibet Plateau;Sentinel-21403|2392|7<HTML><L-PDF><Enhanced-PDF><Meta-XML>Updated:2023-05-10
- Abstract:Tibetan Plateau (TP) lakes are located in the high-altitude and rough-terrain region. These lakes are effective indicators and sentinels of climate changes because of the absence of direct anthropogenic influence and their dominant distribution in endorheic basins. Altimetry satellites can be used to monitor the water level changes of inland water bodies. However, satellites cannot easily obtain accurate and continuous observations of Tibetan lakes with steep terrain. This paper presents a robust scheme for constructing accurate and long-term lake level time series using multi-altimeters. We demonstrate the robust scheme over La-ang Co.A robust strategy is presented to obtain lake levels on the TP using multi-altimeter data. The consistency of atmospheric path delay corrections should be carefully checked to integrate various altimeter products issued in different periods. Apparent biases are found in troposphere corrections from different altimeter products and updated by ERA-5 model. ICE retracker is used to correct the altimeter range. A two-step method is proposed for outlier removal, which has accurate performance without any a prior information. Bias adjustment is an essential step in the fusion of multi-altimeters. Tandem mission data of altimeters are used to estimate inter-satellite bias. Finally, a 28-year-long lake level time series are constructed using TOPEX/Poseidon and Jason-1/2/3 altimeter data from 1992 to 2020. The relationship among lake level, area, precipitation, temperature, and evaporation in the basin from 1992 to 2020 is analyzed.The mean lake level for each cycle is estimated after outlier removal. As an example, About 38% of the observations are rejected as outliers in Jason-2 period. The T/P-family satellites share the same ground track and have an overlap between two successive satellites for intersatellite calibration. As a result, Jason-1 has a mean lake level bias of 0.15 m with respect to T/P. The bias of Jason-2 with respect to Jason-1 is 0.02 m. The bias of Jason-3 with respect to Jason-2 is -0.23 m after removing an outlier. Biases between different missions are adjusted, and a 28-year monthly lake level time series is generated. Compared to the in situ data and available lake level databases, our result is the most robust time series for La-ang Co, with high accuracy and considerably continuous samples from 1992 to 2020. The mean STD is about 13.10 cm for T/P-family satellites. From 1992 to 2020, the level of La-ang Co decreased by 6.00 m, with an average change trend of -0.21±0.01 m/a.This result showed that the lake level extraction in this study is more accurate than that of available lake level databases, and the change of lake levels in La-ang Co is similar with the previous studies. Annual and semi-annual variations as well as inter-annual oscillations can be clearly observed in the time series. Evaporation is greater than precipitation, which is the main factor leading to the decrease of lake level. The water level of La-ang Co will continue to decline in the near term due to global warming.Keywords:satellite altimetry;TOPEX/Poseidon;Jason-1/2/3;La-ang Co;lake level;Tibetan Plateau1798|2493|11<HTML><L-PDF><Meta-XML>Updated:2022-04-30
- Abstract:Lake ice phenology refers to the dates of lake freeze-up and break-up and period of ice cover; it is considered a valuable indicator of regional climate change. The shifts of lake ice phenology in association with a warming climate is widely interesting because it not only serves as evidence of the changes in climate but could show substantial impacts on regional hydrological processes and the aquatic ecosystem. Ground-based records of lake ice phenology over the Tibetan Plateau are limited because of the harsh geographical conditions and the high observation costs. Satellite-based observation and modeling are expected to be effective in investigating the long-term changes in lake ice phenology for regions with poor ground observations. We aim to reconstruct the lake ice phenology time series and to identify the long-term changes of lake ice phenology in responding to the climate of Nam Co Lake at the Tibetan Plateau and for the past 60 years based on a process-based model, where remotely sensed lake surface water temperature is used to calibrated the process-based model.The research framework includes retrieving lake surface water temperature and lake ice phenology information from remotely sensed data, calibrating the process-based model against the remotely sensed lake surface water temperature, determining lake ice phenology according to the simulated water temperature, validating the simulated lake ice phenology by comparing against that derived from the remotely sensed data, detecting the long-term trends in the reconstructed lake ice phenology, and modeling the response of lake ice phenology to changes in air temperature. Four different remotely sensed datasets and the corresponding approaches are used to retrieve lake ice phenology of the Nam Co for the period 2000—2015. The process-based model (LAKE 2.3) is a 1D lake surface energy balance model. It is used to reconstruct lake ice phenology of Nam Co for the period 1963 to 2018 and investigate the sensitivity of lake ice phenology to climate change. The Mann–Kendall nonparametric statistical test approach is used in detecting the trend of lake ice phenology.Lake ice phenology derived using different remotely sensed data and approaches with consistency in the trend but with considerable uncertainties due to the temporal and spatial resolution of the sensors. The reconstructed lake ice breaking-up date based on the model is more comparable to that remotely sensed data than the other lake ice phenology indicators. The reconstructed time series of lake ice phenology shows that, during the previous 57 years, the freezing-up date was significantly delayed whereas the breaking-up date was earlier, thereby resulting in a shortened ice cover duration. The ice cover duration is shortened at a rate of 6.4 days/10a during the period 1963 to 2018. Sensitivity analysis shows that the breaking-up date would be significantly earlier in a warm climate. Under the 2 °C warmer scenario, the breaking-up date would be 12.4 days earlier on the average, and the ice cover duration would be shortened by 19.7 days, on the average.This study combines the strengths of remote sensing and numerical modeling in forming a novel research framework to reconstruct lake ice phenology of regions with poor ground-observation, such as the Tibetan Plateau. The results show that the framework is reliable and valuable to explore the long-term changes in lake ice phenology and its response to climate change. However, uncertainties exist in the remotely sensed lake ice phenology and the numerical modeling, which needs to be improved and further validated where or when ground-based observations are available.Keywords:Lake ice phenology;multi-source remote sensing;lake model;Nam Co;Tibetan Plateau1791|2436|11<HTML><L-PDF><Meta-XML>Updated:2022-04-30
- Abstract:Lakes are very sensitive to the impacts of climate change and human activities. The lakes over the Tibetan Plateau (TP) are numerous and extensively distributed; they are an important part of the Asian water towers. Understanding the interactions of the Earth system’s circles and the mechanism of environmental changes on the TP requires less disturbance from human activities. What is the response of TP’s lakes to climate change as sensitive indicators in the context of rapid global warming? Based on the lake area mapping with multispectral images, lake water level changes from satellite altimetry data, and lake water volume changes with digital elevation model. This study synthesizes the research progress of area, level, and water volume changes of lakes (larger than 1 km2) on the TP in the past nearly 50 years. The main conclusions are as follows: (1) the total number of lakes on the TP increased from 1080 in the 1970s to 1424 in 2018 (+32%), the total lake area expanded from 40,000 km2 to 50,000 km2 (+25%), the average water level of lakes increased by approximately 4 m, and the lake water storage increased by nearly 170 billion tons. (2) The changes in lake area, water level, and water volume decreased slightly from the 1970s to 1995, and then showed a rapid but nonlinear increase. The lake area, water level, and volume increased in the north-central plateau but decreased in the south. (3) A quantitative lake water balance based on multisource remote sensing data reveals that increased precipitation is the main driver of lake expansion, followed by glacier ablation contribution. Several scientific frontiers facing the challenge are also summarized as follows: (1) quantitative evaluation of the causes of individual lake change. At present, a quantitative study on the causes of lake change indicates the contribution of glacial mass loss to the increase in lake water volume, and precipitation, evaporation, and permafrost underground ice ablation that contribute to the increase in lake water. New driving data sets should be developed and hydrological models from the watershed scale should be further combined to estimate lake water balance. (2) Driving mechanisms of lake changes. The driving mechanisms of lake changes on the TP are currently analyzed mainly to enhance precipitation on the plateau. In the future, climate dynamics theory and hydrological models should be combined to further improve understanding of the driving mechanisms of spatial and temporal differences between the climate system and the cryosphere affecting lake changes on the TP. (3) New satellite remote sensing technology should be combined to understand the past, present, and future lake evolution on the TP. Remote sensing, as an indispensable modern technical means of air-sky-earth, plays a greater role with the implementation of the Second TP Scientific Expedition and Research plan on the TP, and more new satellites are launched one after another to improve understanding of the evolution pattern and change mechanism of lakes on the TP.Keywords:lake;remote sensing;area;level;volume;Tibetan Plateau5039|5199|33<HTML><L-PDF><Meta-XML>Updated:2022-04-30
- Abstract:River networks play an important role in the terrestrial water. They have become a hotspot in river remotely sensed studies on using remotely sensed imagery to monitor river dynamic changes. Recent development of CubeSat satellite, such as PlanetScope, allows monitoring of river networks at high spatial and high temporal resolution by providing near-daily revisit time imagery at 3 m spatial resolution. We selected the Yangtze headwaters (Tongtian river basin, ~227 km²) located in Tibetan Plateau as the study area. Five CubeSat images from May to October in 2017 were selected to extract river networks at 3 m resolution by enhancing the river cross sectional and longitudinal features, in order to monitor dynamic changes of in river networks at high-spatial resolution. In addition, we compared the 3 m CubeSat river networks with 30 m Landsat 8 and 10 m Sentinel-2 river networks, and the five existing hydrography data products including GRWL, GSW, FROM-GLC, OpenStreetMap, and HydroSHEDS. We concluded that: (1) Rivers in the study area begin to develop in May with drainage density of 0.38 km-1. July and August are the wet seasons, and the drainage density reaches the peak (0.61 km-1). In September, rivers reach the mean discharge with drainage density of 0.53 km-1, and then the rivers degrade gradually with drainage density of 0.37 km-1 and begin to freeze in October. (2) The high spatial resolution CubeSat river networks include more small rivers (3—30 m wide), and the CubeSat river length is 1.6 and 1.3 times larger than Landsat 8 and Sentinel-2 river networks, respectively. (3) The drainage density of CubeSat river networks is 2.9 to 12.4 times larger than existing hydrography data products, thereby compensating for any lack in the spatial and temporal resolution of the existing river network products.Keywords:river network;remote sensing information extraction;dynamic monitoring;CubeSat;Tibetan Plateau1457|2274|4<HTML><L-PDF><Meta-XML>Updated:2021-10-21
Performance of cloud fraction of three satellite cloud climate date records over the Tibetan Plateau
Abstract:Tibetan Plateau (TP) plays an important role in adjusting the large-scale atmospheric circulation in the northern hemisphere and the atmosphere–sea interaction from the equator to the middle latitude in the North Pacific. Obtaining complete observation data based on ground observations over TP is difficult. Satellite provides good observational data over the Tibetan Plateau. Considering the complex underlying surface types and geographical elevations in the Tibetan Plateau region, three kinds of long-term cloud fraction data that came from PATMOS-x/AVHRR, CLARA-A2/AVHRR, and MODIS / Aqua were analyzed from the perspective of data retrieval methods and data spatial attributes.The relationship among the three kinds of satellite cloud fraction and the ground observation cloud fraction was analyzed at first. Correlation analysis, linear trend, and accumulate bias were used to analyze the data. The analysis data were selected from instantaneous orbital observations and monthly and annual mean value.The annual mean cloud fraction of the three kinds of data are similar, but seasonal cloud fraction is different. CLARA-A2 has the smallest cloud fraction in summer and the highest cloud fraction in winter. Patmos-x agreed well with the ground observation. The correlation relationship between CLARA-A2 and ground was weak. Aqua/MODIS had good relationship in autumn and less correlation in spring and summer.The three kinds of long-term cloud fraction data showed similar spatial and temporal distribution. During daytime, CLARA-A2 has larger cloud fraction than MODIS and PATMOS-x. At nighttime, MODIS has the maximum cloud fraction value, and PATMOS-x and CLARA-A2 have similar values. All three kinds of cloud data committed a mistake with snow along the ridge of a mountain. The linear regression and accumulate bias analysis showed that the annual mean cloud fraction of PATMOS-x and CLARA-A2 displayed a decreasing trend from 1982 to 2015. The trend of the night time cloud fraction was more obvious than that of daytime. CLARA-A2 displayed more obvious trend than PATMOS-x, especially at night. The year of 2000 is a turning point for the change in cloud cover over the plateau area from high to low. In January, April, and October, the decrease in cloud amount is the main change trend. Meanwhile, in July, the weak increase is the main change characteristic.Three kinds of satellite cloud data have good comparability. Three kinds of data obtained different correlations when compared with the ground observation. The reasons may come from matched data with different spatial and temporal characteristics, different payloads with various observation abilities and different data set with different cloud detection algorithms.The stability of satellite orbit and high quality of instrument calibration are the baselines of long-term climate data. MODIS has stable instrument orbit and calibration. Thus, its long term cloud data have good homogeneity.Keywords:cloud fraction;satellite;climate data records;Tibetan Plateau;Patmos-x;CLARA-A2;MODIS1532|4621|4<HTML><L-PDF><Meta-XML>Updated:2021-07-23


