
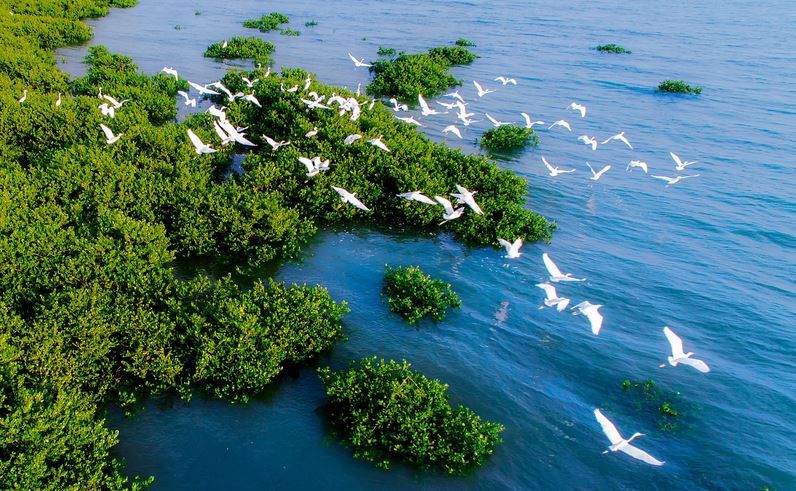
Mangrove Remote Sensing Column
- The Paper
Spatio-temporal probability threshold method of remote sensing for mangroves mapping in China
Abstract:As an appropriate forest community in tropical and subtropical coastal zone, mangrove has unique ecological function and great social and economic value. However, mangroves globally are decreasing at an average rate of 1% per year and are facing threats, such as the reduction of biodiversity and the degradation of ecosystem service functions. Mangroves in China have experienced repeated destruction and protection, and remote sensing monitoring can provide scientific support and decision-making reference suggestions for implementing large-scale mangrove ecosystem protection and restoration in China. Based on Google Earth Engine platform, this study proposed a Spatio-temporal Probability Threshold Method to extract mangrove extent in China, and it is conducive to analyzing the temporal and spatial changing trends of mangroves in China.In this study, we selected 516 images of Landsat 8 in 2015. We used unsupervised classification for land-water separation, and then generated the potential growth area of mangroves. A multi-feature decision tree classification method was constructed based on multiple indexes and spectral information to extract rough mangrove growth extent, and the mangrove growth probability was further calculated based on long time-series data. The probability threshold was determined through experiments to extract precise mangrove extent. In addition, we set up four comparative experiments for mangrove extraction, using two decision tree classification methods (based on spectral indices only and based on original bands only) and two supervised classification methods (CART and SVM).Results show that the best mangrove probability threshold is 0.5, and the producer’s accuracy for mangrove is 90.36%. CAS_Mangrove dataset has the highest producer’s accuracy for mangrove (91.73%), but the details of the edge are inaccurate; the producer’s accuracy for mangrove of GMW dataset is the lowest (64.64%), thereby ignoring the young and scattered mangroves. All methods of four comparative experiments overestimate the mangrove extent in varying degrees. The total area of mangroves in China in 2015 extracted by the proposed method is 21932 hectares.This study proposed a Spatio-temporal Probability Threshold Method for mangrove extraction, considering the impact of tidal inundation from a new perspective through the mangrove growth probability. This method has high accuracy (90.36%) of mangrove extraction, and it can extract young and scattered mangroves effectively. According to the study, the distribution of mangrove in China in 2015 was obtained, and the total area of mangroves in China is 21932 hectares. The mangroves are mainly distributed in Guangxi and Guangdong, accounting for 73.22 percent of the country’s area. Compared with the method of selecting images at low tide for mangrove extraction, Spatio-temporal Probability Threshold Method makes full use of Landsat data, which are simpler and faster, and avoids the high uncertainty in the artificial coastal area.Keywords:remote sensing;Google Earth Engine;Landsat;mangroves;long time-series;CMRI2419|4899|4 <HTML><L-PDF><Enhanced-PDF><Meta-XML>Updated:2022-08-04
Long time-series remote sensing monitoring of mangrove forests in the Guangdong-Hong Kong-Macao Greater Bay Area
Abstract:With the explosive growth of remote sensing images, the contradiction between the refined requirements of the change processing analysis and the lack of local computing power has become increasingly prominent. The emergence of Google Earth Engine (GEE) geographic cloud platform has solved the pain points of the industry, where users are strained with computing power.The Guangdong-Hong Kong-Macao Greater Bay Area (GHM) is considered the study area, and an annual wetland classification data set from 1987 to 2020 is constructed with the support of GEE. It is analyzed for the temporal phase characteristics and spatial expansion process of mangroves, and the result reveals the positive effects of the establishment of protected areas and tidal flat afforestation on the mangrove protection and restoration by combining the accurate time point of change identified by the continuous long time series analysis.The imaging quality of optical images is greatly reduced because the study area is located in a tropical and subtropical cloudy and rainy area. To fully use the satellite remote sensing multitemporal features to effectively eliminate clouds/shadows, all Landsat images during the time period are collected to form a continuous time series. With the support of the GEE cloud platform to satisfy the requirements of computing power for the large amounts of data, the random forest algorithm is applied to obtain the annual wetland classification data set from 1987 to 2020. On this basis, the spatio-temporal characteristics of mangrove over long time are mined.According to the accuracy assessment, the averaged out-of-bag error of wetland data set is 6.61%±0.08%, and the average identification accuracy for mangroves is 89.64%±0.13%. In 2020, the Greater Bay Area has 2,174 ha of mangrove forests, and 81% of the mangrove forests is concentrated in Shenzhen Bay, Qi’ao Island, and Zhenhai Bay. The mangrove forests in the GHM experience steady development (1987—2003) and then rapid growth (2003—2020), the main increase is observed in Zhenhai Bay (40%) and Qi’ao Island (28%). The mangrove forests in Qi’ao Island and Zhenhai Bay are still in a period of rapid growth. However, Qi’ao Island has the fastest growth rate; it has doubled its area by 30 times since 2002. Shenzhen Bay has entered a stable period (2009—2020) after its early rapid growth (1987—2009). Shenzhen Bay became the only mangrove distribution area that formed a stable core area in the GHM due to the early establishment of the reserve. Although Zhenhai Bay has the largest area of mangrove forests, the ecosystem is more fragile because of the narrow width and the fragmented landscape.The establishment of nature reserves and tidal flat afforestation has played an important role in the growth of mangrove area. Integrated monitoring, such as satellites, drones, and ground monitoring, should be incorporated into the mangrove protection and restoration assessment. This study provides scientific evidence support for the implementation of the sustainable development strategy goals of the GHM and has a certain guiding role in the construction of coastal ecological barriers.Keywords:remote sensing;Mangrove forests;continuous long time series;Google Earth Engine;Guangzhou-Hong Kong-Macao Greater Bay Area;spatio-temporal information mining;spatial expansion processing3536|5559|28<HTML><L-PDF><Enhanced-PDF><Meta-XML>Updated:2022-08-04Disturbance of mangrove forests in Guangxi Beilun Estuary during 1990—2020
Abstract:Mangrove forests are highly productive ecosystems that maintain coastal ecological balance and biodiversity by providing breeding and nursing grounds for waterfowl, marine, and pelagic species. Mangroves are highly subjected to natural and anthropogenic disturbances, owing to their intermediate position between the terrestrial and marine environments. This study used Landsat imagery to track the temporal and spatial changes of mangrove forests in Guangxi Beilun Estuary National Nature Reserve. The objectives of this study are (1) to monitor spatial distributions and intensities of mangrove forest disturbances during the past 30 years, and (2) to analyze the natural and anthropogenic factors that cause these disturbances in the reserve.This study used the Google Earth Engine (GEE) platform to establish a time series Landsat dataset during 1990—2020. And then, GEE constructed the image dataset stack using the Medoid method for annual best pixel composition. Based on LandTrendr algorithm and the dataset, we studied disturbances of mangrove forests in Guangxi Beilun Estuary National Nature Reserve from 1990 to 2020. GEE enables quick access and processes a massive number of Landsat images in a paralleled process. Specifically, the GEE synchronizes all the Landsat data and provides different levels of processed products, including the top of atmosphere and surface reflectance data. LandTrendr algorithm can be used to detect changes in the time series of satellite images pixel by pixel and capture pixel-level subtle disturbances.The results show that (1) during 1990—2020, the total area of mangrove forest disturbances in the Beilun Estuary Reserve in Guangxi was 45.94 ha. Most disturbances occurred near pearl Bay, and a small amount of disturbances occurred in Beilun estuary; (2) the maximum disturbed area occurred in 2001, which was 12.91 ha, and the minimum disturbed area occurred in 2007, which was 0.09 ha; (3) slight, moderate, and severe disturbances accounted for 57.5%, 29.17%, and 13.33% of the total disturbance, respectively, and the areas are 26.42, 13.40, and 6.13 ha.According to our results and literature reviews, the following conclusions can be drawn: natural and anthropogenic factors cause the disturbance of mangrove forest in Guangxi Beilun Estuary National Nature Reserve. In terms of natural factors, sea level rise, extreme weather, pests and diseases, and invasion of spartina alterniflora have seriously threatened the growth environment of mangroves. In terms of human factors, cultivation ponds and farmland reclamation directly occupy the growth environment of mangroves. Mangroves are also threatened by wastewater from aquaculture ponds and pesticide residues in cultivated land. Parts of the terrigenous mangroves are developed as dikes or other artificial surfaces to attract residents or visitors. This condition has also led to an increase in wastewater from domestic production; not only does it hinder the growth of mangroves, but it also hinders the flow of matter and energy between land and sea. In addition, results of this study can serve as an important scientific basis and fundamental data for formulating mangrove protection and restoration strategies.Keywords:remote sensing;mangroves;protected areas;Google Earth Engine (GEE);Land Trendr algorithm2148|2911|8<HTML><L-PDF><Enhanced-PDF><Meta-XML>Updated:2022-08-04Fusion of Landsat 8 and Sentinel-2 data for mangrove phenology information extraction and classification
Abstract:Scientific and accurate monitoring of mangroves is the basis and premise for the protection of marine coastal and transitional ecosystem. However, mangroves are mainly distributed in the intertidal zone, result in large-scale manual monitoring a tough task. Although remote sensing technology can map mangrove within for long time and large area, the existing studies have some shortcomings. On the one hand, mangroves are often distributed in tropical and subtropical regions, where long-term coverage of effective optical remote sensing data is difficult to obtain due to weather conditions. On the other hand, mangroves are easily confused with other terrestrial vegetation by only using spectral information.In this paper, we choose the Sundarbans located in the Ganges River Delta as the study area. Landsat 8 OLI and Sentinel-2 MSI data in 2016 are obtained based on GEE (Google Earth Engine) to conduct mangrove extraction in this research. Firstly, the relation between the two sensors for the same index is constructed based on a least square regression model, which is used to reconstruct the time series data. In this phase, EVI (Enhanced Vegetation Index) and LSWI (Land Surface Water Index) are selected according to the separability criterion. Secondly, Savitzky-Golay filtering is applied to the time series data of the two indices, and 13 phenology metrics are extracted. Finally, these metrics of the two indices are cascaded, and Random Forest (RF) is used to extract the area of mangrove.Fusing the Landsat 8 OLI and Sentinel-2 MSI can effectively improve the quality of time series data. Compared with the classification results based on single sensor data, the overall accuracy is improved by 1.58%. Phenology information can significantly enhance the separability between mangrove and other vegetation, with a 1.92% improvement of overall accuracy compared with the classification results using time series data directly. Considering both EVI and LSWI indices can greatly improve, the classification effect, with 14.11% and 9.69% improvements compared with using a single index. Therefore, the method in this paper can effectively extract mangroves, with the overall accuracy and Kappa coefficient reaching to 91.02% and 0.892 respectively.This research takes full account of the deficiency of optical remote sensing monitoring, biological characteristics and geographical characteristics of mangroves, which can extract the area of mangroves more objectively and accurately. Compared with other similar studies, the differences and characteristics of this study are: (1) Jointly using EVI and LSWI time series to describe the phenological information of mangroves can effectively differentiate mangroves and evergreen forests; (2) We introduce phenology information into mangrove classification using remote sensing for the first time, and verify the feasibility of using phenology information to monitor the range of mangrove. The method proposed in this paper may be benefit for scientific and accurate monitoring of global or regional mangroves.Keywords:remote sensing;mangrove;data fusion;phenology information;time series;GEE;random forests3581|3974|21<HTML><L-PDF><Enhanced-PDF><Meta-XML>Updated:2022-08-04Spatial distribution pattern of mangrove community in tidal flats of the Qinjiang Estuary
Abstract:Mangrove community is a special ecosystem along tropical and subtropical estuaries. It has important values in attenuating large waves, promoting silting, and storing carbon. However, due to the global sea level rise and human disturbances, mangrove habitats have been destroyed with fragile community structures. Therefore, based on the UAV orthophoto image with field verification, historical remote sensing images, water salinity, and sediment samples in tidal flats along the Qinjiang estuary, the spatial distribution patterns of mangrove community in the tidal flat and associated influence factors of the Qinjiang estuary were analyzed. The results are as follows: (1) Tidal flats of the Qinjiang estuary mainly consist of A. corniculatum and S. apetala, where the “mangrove pure forest community” with A. corniculatum is an absolutely dominant species in this area. Meanwhile, gradually developed patterns from “mangrove pure forest community” in the estuarine tidal flats are found in the combination of “mangrove plant–semi-mangrove plant” and “mangrove plant–semi-mangrove plant–non-mangrove plant” in the tidal reach. (2) A. corniculatum is the frontier pioneer tree species of the seaward grown mangroves in the Qinjiang estuary. The forefront elevation of the A. corniculatum biennial seedling distribution is 0.11 m below local sea level, and the forefront elevation of A. corniculatum viviparous seedling distribution is 0.37 m below local sea level. Meanwhile, the distributed limit of the mangroves in the upstream of the Qinjiang Estuary is A. corniculatum, where the location of distribution limit in viviparous seedlings in that year is 10.18 km away from HS00 station. (3) The tidal water level and salinity of the Qinjiang estuary are the main driving factors for the distribution of mangrove communities, and the growth and development of mangrove plants were determined by the variations in grain size of sediments. These findings can provide theoretical and technical guidance for the present ecological restoration projects of mangrove communities in the mountainously tropical- estuaries of the world.Keywords:remote sensing;Mangrove community;distribution of limit;unmanned aerial vehicle orthoimage;estuarine tidal flat;Qinjiang estuary1808|2138|8<HTML><L-PDF><Enhanced-PDF><Meta-XML>Updated:2022-08-04Mangrove species classification with combination of WorldView-2 and Zhuhai-1 satellite images
Abstract:Remotely sensed classification of mangrove species is affected by image resolution, spectral information, classification strategy, and image feature selection methods. The present studies of mangrove species classification using remote sensing mostly focus on comparison of classification accuracy, and few of them discuss the spatial pattern of species distribution and the corresponding influencing factors. The combination of high-resolution and hyperspectral satellite images in species classification of mangrove forest has received less attention. With WorldView-2 and Zhuhai-1 images in Gaoqiao mangrove Reserve, this study aims to compare the effects of different feature selection methods (XGBoost, eXtreme gradient boosting; ERT, extremely randomized trees; SPA, successive projections algorithm) and different image resolutions (the WorldView-2 image with a resolution of 0.5 m was resampled to 1, 2, 4, 8, and 10 m) on the classification accuracy of mangrove species based on random forest classification model and to explore the spatial pattern of mangrove distribution and the corresponding influencing factors based on the coupling of WorldView-2 and Zhuhai-1 images.With each spatial resolution of WorldView-2 image, 248 features were extracted, including 52 spectral features (eight spectral bands, 38 vegetation indices, three principal component bands, and three tasseled cap transformation bands) and 196 texture features (seven windows of 3×3, 5×5, 7×7, 9×9, 11×11, and 15×15; for each window, 28 texture features were extracted). With Zhuhai-1 hyperspectral image, 117 spectral features (32 original spectral bands, 32 first derivative bands, 47 vegetation indices, three principal component bands, and three tasseled cap transformation bands) were extracted.Results showed that XGBoost was superior to ERT and SPA, which had great advantage in image feature selection. Among the six types of WorldView-2 image resolution, the 2 m resolution was optimal for species classification, and the red edge band (705—745 nm) played an important role in species classification. The coupling of WorldView-2 and Zhuhai-1 images (resolution: 2 m, overall accuracy: 88.98%, kappa coefficient: 0.846) had better performance than using single WorldView resolution: 2 m, overall accuracy: 83.47%, kappa coefficient: 0.768 and Zhuhai-1 image (resolution: 10 m, overall accuracy: 78.50%, kappa coefficient: 0.703). The classification map based on the coupled image features illustrated that the area of Aegiceras corniculatum accounted for the largest proportion (33.77 % ), followed by Bruguiera gymnorrhiza (30.44%), Avicennia marina (26.96%), Bruguiera gymnorrhiza (6.08%), Sonneratia apetala (2.72%), and Kandelia candel (0.02%). Moreover, to some extent, forest gap, surface elevation, and offshore distance greatly affected the spatial distribution pattern of mangrove species.This study demonstrated that the combination of WorldView-2 and Zhuhai-1 image had great potential in accurate mapping mangrove species at the landscape and regional scales, thereby facilitating biodiversity protection and scientific management of forest ecosystem and providing technical and data support for retrieval of ecosystem parameters (e.g., carbon storage, net primary production, and leaf area index) and health evaluation of mangrove forests. Future research will focus on the fusion of WorldView-2 and Zhuhai-1 image to simultaneously achieve high spatial resolution and hyperspectral bands and the inclusion of canopy height and leaf trait information (e.g., chlorophyll and water content) to the classification model.Keywords:remote sensing;mangrove;WorldView-2 image;Zhuhai-1 image;Species classification;XGBoost;Extremely randomized trees;Successive projections algorithm1846|3627|12<HTML><L-PDF><Enhanced-PDF><Meta-XML>Updated:2022-08-04Fine identification and biomass estimation of mangroves based on UAV multispectral and LiDAR
Abstract:Mangroves are special types of woody plants that grow exclusively in the intertidal zones of the tropics and the subtropics. With respect to environmental and ecological values, mangroves protect the shoreline from tides, winds, and storms and act as the first line of defense against extreme weather in coastal areas. Moreover, mangroves have a continuous carbon fixation capacity, which is much higher than those of peat swamp and coastal salt marsh. Mangroves are an important part of the earth carbon cycle system and considered an important blue carbon sink on the sea and land margin. However, mangrove habitat is threatened all over the world due to human development and utilization activities. Therefore, monitoring the spatial distribution of mangrove types and biomass will help guide policy-makers in taking effective utilization and protection measures.In this paper, on the basis of UAV multispectral images and LiDAR point cloud data, the support vector machine classification method is used for mangrove identification. Furthermore, mangrove species are distinguished according to different heights and distribution areas using the elevation information in the UAV LiDAR point cloud data. The structure characteristics of mangrove single wood are extracted by the point-cloud-based cluster segmentation method, and an estimation model of the tree height, canopy, and aboveground biomass obtained by LiDAR remote sensing is constructed, Finally, the aboveground biomass of mangrove in the study area is calculated, and its spatial distribution information is analyzed.The classification result of the species types of mangroves, which is combined with the multi spectrum and LiDAR point cloud data, can reach 90.69% in total accuracy. The kappa coefficient is 0.88. The accuracies of the algorithm in identifying single trees of Kandelia candel and Aegiceras corniculata are 86.71% and 60.21%, respectively. Among them, the middle errors of the heights of K. candel and A. corniculata are 0.36 and 0.18 m, respectively, and the crown width extraction precision of K. candel is higher than that of A. corniculata. The regression models of the aboveground biomass of K. candel and A. corniculata are constructed. The accuracy of the fusion model is the highest, and the respective decision coefficients (R²) are 0.678 and 0.832 for K. candel and A. corniculata.Mangroves are mostly planted artificially in the study area and distributed in a belt perpendicular to the dam: K. candel—Cyperus malaccensis Lam. and Acanthus ilicifolius L. —A. corniculata. The area of A. corniculata is the largest, which is approximately 8.91 hm2 and distributed on both sides of the tidal ditch far from the dam. The area of K. candel is 4.69 hm2, which is distributed in the area near the dam. C. malaccensis Lam. and A. ilicifolius L. are scattered in small areas among the different types of objects. The aboveground biomass of mangrove is calculated by the estimation model of above ground biomass. The aboveground biomass follows the order Sonneratia apetala > A. corniculata > C. malaccensis Lam. > K. candel > A. ilicifolius L. The distribution range of mangrove’s aboveground biomass is 1.24—3.6 kg/m2.Keywords:remote sensing;mangrove;UAV;multispectral;lidar;Tree Species Classification;aboveground biomass3924|6373|16<HTML><L-PDF><Enhanced-PDF><Meta-XML>Updated:2022-08-04Estimation of mangrove canopy chlorophyll content using hyperspectral image and stacking ensemble regression algorithm
Abstract:Mangroves are one of the most productive and valuable wetland ecosystems in the world. Canopy Chlorophyll Content (CCC), as an important biophysical parameter, is an important indicator to evaluate mangroves’ productivity and health status.This study calculated traditional vegetation index, combined vegetation index using Zhuhai-1 Hyperspectral Satellite (OHS) and Sentinel-2A multispectral images, and produced high-dimensional datasets. Dimension reduction and variable selection were carried out by combining normal distribution test, correlation analysis, and importance evaluation of feature variables. The optimal inversion model of mangrove CCC in the Beibu Gulf was built using single linear regression, machine learning regression, and stacking ensemble learning regression algorithm. This study demonstrated the inversing accuracy difference between OHS image and Sentinel-2A data, and evaluated the applicability of SNAP-SL2P algorithm in mangrove CCC inversion.Results showed that (1) eight optimal feature variables are selected from the high-dimensional datasets of OHS image by statistical test, maximum correlation coefficient, and variable importance evaluation. Combining vegetation indexes (RSI(12,17), DSI(12,18), and NDSI(6,12)) highly contributes to the inversion of mangrove CCC. (2) The training accuracy of the GBRT-based optimal stacking ensemble learning regression model using OHS data (Score=0.999, RMSE=0.963 μg/cm2) was higher than that of the optimal RF regression model (RMSE reduced by 7.531 μg/cm2), which is better than the optimal Lasso linear regression model (RMSE reduced by 19.383 μg/cm2). (3) The inversion accuracy of the optimal stacking ensemble learning regression model using OHS data (R2=0.761, RMSE=16.738 μg/cm2) is higher than that from Sentinel-2A image (R2=0.615, RMSE=20.701 μg/cm2). (4) The optimal stacking ensemble learning regression model using OHS and Sentinel-2A data in estimating mangrove CCC outperforms the SNAP-SL2P algorithm (R2=0.356, RMSE=49.419 μg/cm2).The conclusion demonstrated that normal distribution test, maximum correlation coefficient method, and XGBoost-based feature selection method can effectively reduce the redundancy of high-dimensional datasets, and obtain the optimal feature variables. The optimal stack GBRT ensemble learning regression model with the OHS data has the highest training accuracy, which is the optimal inversion model for estimating CCC of the mangrove. The R2 of OHS and Sentinel-2A data is over 0.61, which indicated that OHS and Sentinel-2A data can effectively estimate mangrove CCC. SNAP-SL2P algorithm cannot effectively inverse mangrove CCC (R2 is less than 0.4) and systematically underestimates CCC value.Keywords:mangrove;canopy chlorophyll content;Zhuhai-1 Hyperspectral Satellite;stacking ensemble learning regression algorithm;feature dimension reduction;remote sensing inversion1685|3500|12<HTML><L-PDF><Enhanced-PDF><Meta-XML>Updated:2022-08-04Retrieving canopy nitrogen content of mangrove forests from Sentinel-2 super-resolution reconstruction data
Abstract:Nitrogen content is an essential element in the whole life cycle of vegetation. The estimation of mangrove Canopy Nitrogen Content (CNC) by remote sensing is greatly important for mangrove health monitoring. At present, studies that use satellite hyperspectral data to retrieve CNC of forest at regional scales, especially for mangroves, are few. In addition, the low spatial resolution of most satellite hyperspectral images and the difficulty of measuring the average leaf nitrogen content of a single image pixel in real time limit the inversion accuracy. In this study, the super-resolution reconstruction of Sentinel-2 image and in-site measurement data was used for retrieving mangrove CNC to explore the application potential of enhanced Sentinel-2 image in mangrove monitoring.Taking Zhanjiang Gaoqiao Mangrove National Nature Reserve, China as the study area, the red edge bands, near-infrared, and short wave bands of Sentinel-2 were reconstructed from 20 m to 10 m by resampling, Sen2Res, and SupReMe algorithms, respectively. The reconstructed images are used to build 40 vegetation indices and analyze their correlation with CNC. Then, the SVM-RFE iterative feature deletion method was used to determine the optimal variable combination of mangrove CNC estimation, and the Kernel Ridge Regression (KRR) model was used to construct the prediction model of mangrove CNC. Finally, the optimal model was used to map CNC spatial distribution of mangrove forests.Significant differences in canopy nitrogen content and leaf nitrogen content were found among different mangrove species, and the variation of intraspecific CNC was abundant. The reconstructed images based on Sen2Res and supreme super resolution algorithm not only had high spectral consistency (the R2 values of all bands are above 0.96) with the resampled image, but also significantly improved the clarity and spatial detail of the image compared with the 20 m resolution image. The bands sensitive to mangrove CNC are mainly concentrated in the red band (B4), red-edge band (B5), near-infrared band (B8a), and short-wave infrared band (B11 and B12). Vegetation indices related to red-edge band (RSSI and TCARIre1/OSAVI) are also effective variables to predict mangrove CNC. The inversion accuracy (R2val>0.579) of the reconstructed 10 m image based on the three methods is better than that of the original 20 m image (R2val=0.504). The fitting accuracy of the inversion model based on the reconstructed Sen2Res image (R2val=0.630, RMSE_val=5.133, RE_val=0.179) is almost the same as the resampled (R2val=0.640, RMSE_val=5.064, RE_val=0.179), and its model validation accuracy (R2cv=0.497, RMSE_cv=5.985, RE_cv=0.214) is higher. In addition, the variable number of Sen2Res is the most reasonable.Based on the spectral details and model accuracy of reconstructed images, Sentinel-2 images constructed by Sen2Res algorithm have good application potential in mangrove canopy nitrogen content estimation and can provide effective method reference and data support for fine monitoring of mangrove canopy health status at regional scale. Compared with vegetation, such as crops and grasslands, the factors influencing CNC inversion of mangroves are more complex. Although the influence of the main canopy structure factor (LAI) was considered in this study, other factors, such as species, community structure, leaf inclination, and synergistic changes, in other biochemical components should be further investigated.Keywords:remote sensing;Mangrove forests;Canopy nitrogen content;Sentinel-2;image reconstruction;SVM-RFE;KRR2138|1568|11<HTML><L-PDF><Enhanced-PDF><Meta-XML>Updated:2022-08-04


