
最新刊期
卷 22 , 期 3 , 2018
- 摘要:The Chinese YG-13A mission was launched in November 2015. YG-13A is equipped with a next-generation high-resolution Synthetic Aperture Radar (SAR) sensor in the X-band, with a resolution of up to 0.5 m. China can now obtain high-resolution SAR images globally. YG-13A demonstrates several improvements compared with previous Chinese SAR satellites, and these improvements include (1) higher image resolution due to a new sliding-spot imaging mode; (2) more flexible data acquisition owing to the capability to image the left and right sides; and (3) improvement in the measuring accuracy of instruments. When the radar system is operating, the radar signal travels through the medium between the antenna and ground. The radar signal encounters group delay in the ionosphere and troposphere (atmospheric path delay) because the refractive index of the atmosphere is not uniform. The range accuracy of YG-13A is thus influenced by atmospheric delay time-varying errors. To address the range accuracy problem of YG-13A, a range calibration method that considers atmospheric delay time-varying errors is proposed to improve range accuracy. First, the atmospheric delay correction method using external data is selected to calculate the atmospheric delay correction amount for each calibration scene. Second, the atmospheric delay corrections for each calibration scene are substituted into the range calibration model. Finally, the system error of range measurement is solved with the range calibration model that considers the atmospheric delay time-varying error when a high-precision corner reflector control point is laid on the ground. The plane and elevation precision of the corner reflector control point are better than 0.1 m. When atmospheric path delay is considered, the standard deviation of the slant range calibration values of four sets of data, namely, A1, A2, B1, and B2, is small. Images obtained over Taiyuan and Tianjin test sites show that the range accuracy of YG-13A is approximately 0.70 m in consideration of the atmospheric delay time-varying error. Calibration results show that the method is effective and feasible. The 0.3 m orbital nominal accuracy is close to the theoretical limit. The range accuracy of YG-13A is mainly limited by the orbit accuracy determined by a single-frequency global positioning satellite. The findings prove that the range measurement of SAR does not use the attitude parameter and can achieve high precision.关键词:atmospheric delay correction;YG-13A;range calibration;satellite ranging;geometric accuracy
- 502
- |
- 112
- |
- 4
发布时间:2021-06-07 -
 摘要:Extracting regional rice paddy areas with high precision by using remote sensing data is crucial to agricultural configuration and decision making. However, obtaining images with high temporal and spatial resolutions is difficult because of satellite recycling and rainy weather, which affect the accuracy of rice paddy field extraction. This study developed a new method for mapping rice paddies in cloud-prone areas by using time-series-fused HJ-1B NDVI and phenological parameters. A case study of Dongting Lake area in the middle reaches of Yangtze River, China, was conducted to test this approach. First, the spatial and temporal adaptive reflectance fusion model algorithm was employed to acquire time series NDVI (30 m) by blending HJ-1B NDVI and MODIS13Q1 NDVI. Second, the Savitzky-Golay filter was applied to smooth the time-series-fused NDVI and calculate the phenological parameters. We selected the most effective NDVI dataset by using the Jeffries-Matusita distance to reduce data redundancy. Finally, we combined the selected NDVI with phenological parameters to extract the distribution of rice paddies and evaluated the precision of the results. Results indicated that the spatial detail information of the fused NDVI data was more abundant than that of MODIS data. The true and fused images presented only slight differences visually and had high correlation coefficients. The accuracies of the results obtained using the method proposed were as follows. The producer accuracy of single cropping rice was 85.80%, and the user accuracy was 86.66%. The producer accuracy of double cropping rice was 86.62%, and the user accuracy was 89.14%. The total classification accuracy was 91.71%, and the kappa coefficient was 0.9024. For comparison, the visible and near-infrared (VNIR) data of HJ-1B, the selected NDVI, the phenological parameters, and the dataset that included the previously mentioned three types were used in the control test. For VNIR data, the producer accuracy of single cropping rice was 71.80%, and the user accuracy was 76.81%. Meanwhile, the producer accuracy of double cropping rice was 71.69%, and the user accuracy was 65.33%. The total classification accuracy was 86.36%, and the kappa coefficient was 0.8407. For the selected NDVI, the producer accuracy of single cropping rice was 74.15%, and the user accuracy was 76.38%. Meanwhile, the producer accuracy of double cropping rice was 74.65%, and the user accuracy was 78.41%. The total classification accuracy was 88.54%, and the kappa coefficient was 0.8765. For the phenological parameters, the producer accuracy of single cropping rice was 82.66%, and the user accuracy was 80.59%. Moreover, the producer accuracy of double cropping rice was 81.15%, and the user accuracy was 83.74%. The total classification accuracy was 82.35%, and the kappa coefficient was 0.7933. For the comprehensive dataset, the producer accuracy of single cropping rice was 84.93%, and the user accuracy was 88.76%. Meanwhile, the producer accuracy of double cropping rice was 87.73%, and the user accuracy was 88.77%. The total classification accuracy was 91.50%, and the kappa coefficient was 0.8988. The control test showed that the dataset combining the selected NDVI with the phenological parameters had minimal data redundancy and exhibited the highest accuracy in rice paddy area extraction. In summary, the proposed method can be widely used in regional rice paddy extraction and can effectively solve the problem of missing remote sensing data caused by weather conditions. This method can also be applied to the extraction of other land cover types.关键词:rice;HJ-1B CCD;NDVI;spatial and temporal data fusion;phenological parameters;classification
- 691
- |
- 444
- |
- 17
发布时间:2021-06-07 -
 摘要:A map of carbon storage and its dynamics of forest vegetation comprise the basic dataset for the calculation of the carbon balance of terrestrial ecosystems. Accurate estimation of forest canopy height, which is an important indicator of forest aboveground biomass, is essential for the mapping of carbon storage of forest vegetation carbon. Existing research has indicated that stereo images acquired by professional spaceborne or airborne stereo systems can be used to extract forest canopy height. However, the acquisition of optical photogrammetric images is hindered by cloud coverage and rains. Regional mapping of forest aboveground biomass should be based on the synergy of multiple sources of optical stereo images. Although the Chinese GF-2 is not a satellite specially designed for professional spaceborne photogrammetric systems, GF-2 theoretically possesses a stereo mapping capability because of its high spatial resolution of 0.8 m and rolling capability of ±35°. This study aims to explore the practical feasibility of extracting forest canopy height by using GF-2 stereo imagery. Two scenes of GF-2 images acquired on June 20, 2015, and July 19, 2016, are processed by a commercial stereoscopic processing software to generate the point cloud. A Digital Surface Model (DSM) is derived through the rasterization of the GF-2 point cloud. The canopy height model (CHM) is extracted from GF-2 DSM subtracted by the digital elevation model from LiDAR data. GF-2 CHM and LiDAR CHM are compared. GF-2 CHM exhibits approximately the same spatial pattern as LiDAR CHM. Pixel-by-pixel linear regression shows that GF-2 CHM is highly correlated with LiDAR CHM, with R2 = 0.51 and root-mean-square error = 3.6 m. Stereo imagery acquired by the Chinese GF-2 can be used to describe the vertical structure of forest canopy top. Forest canopy height can be extracted from GF-2 stereo imagery if an understory elevation of the ground surface is available.关键词:forest aboveground biomass;forest height;photogrammetry;stereoscopic observation;GF-2;lidar
- 636
- |
- 241
- |
- 3
发布时间:2021-06-07 -
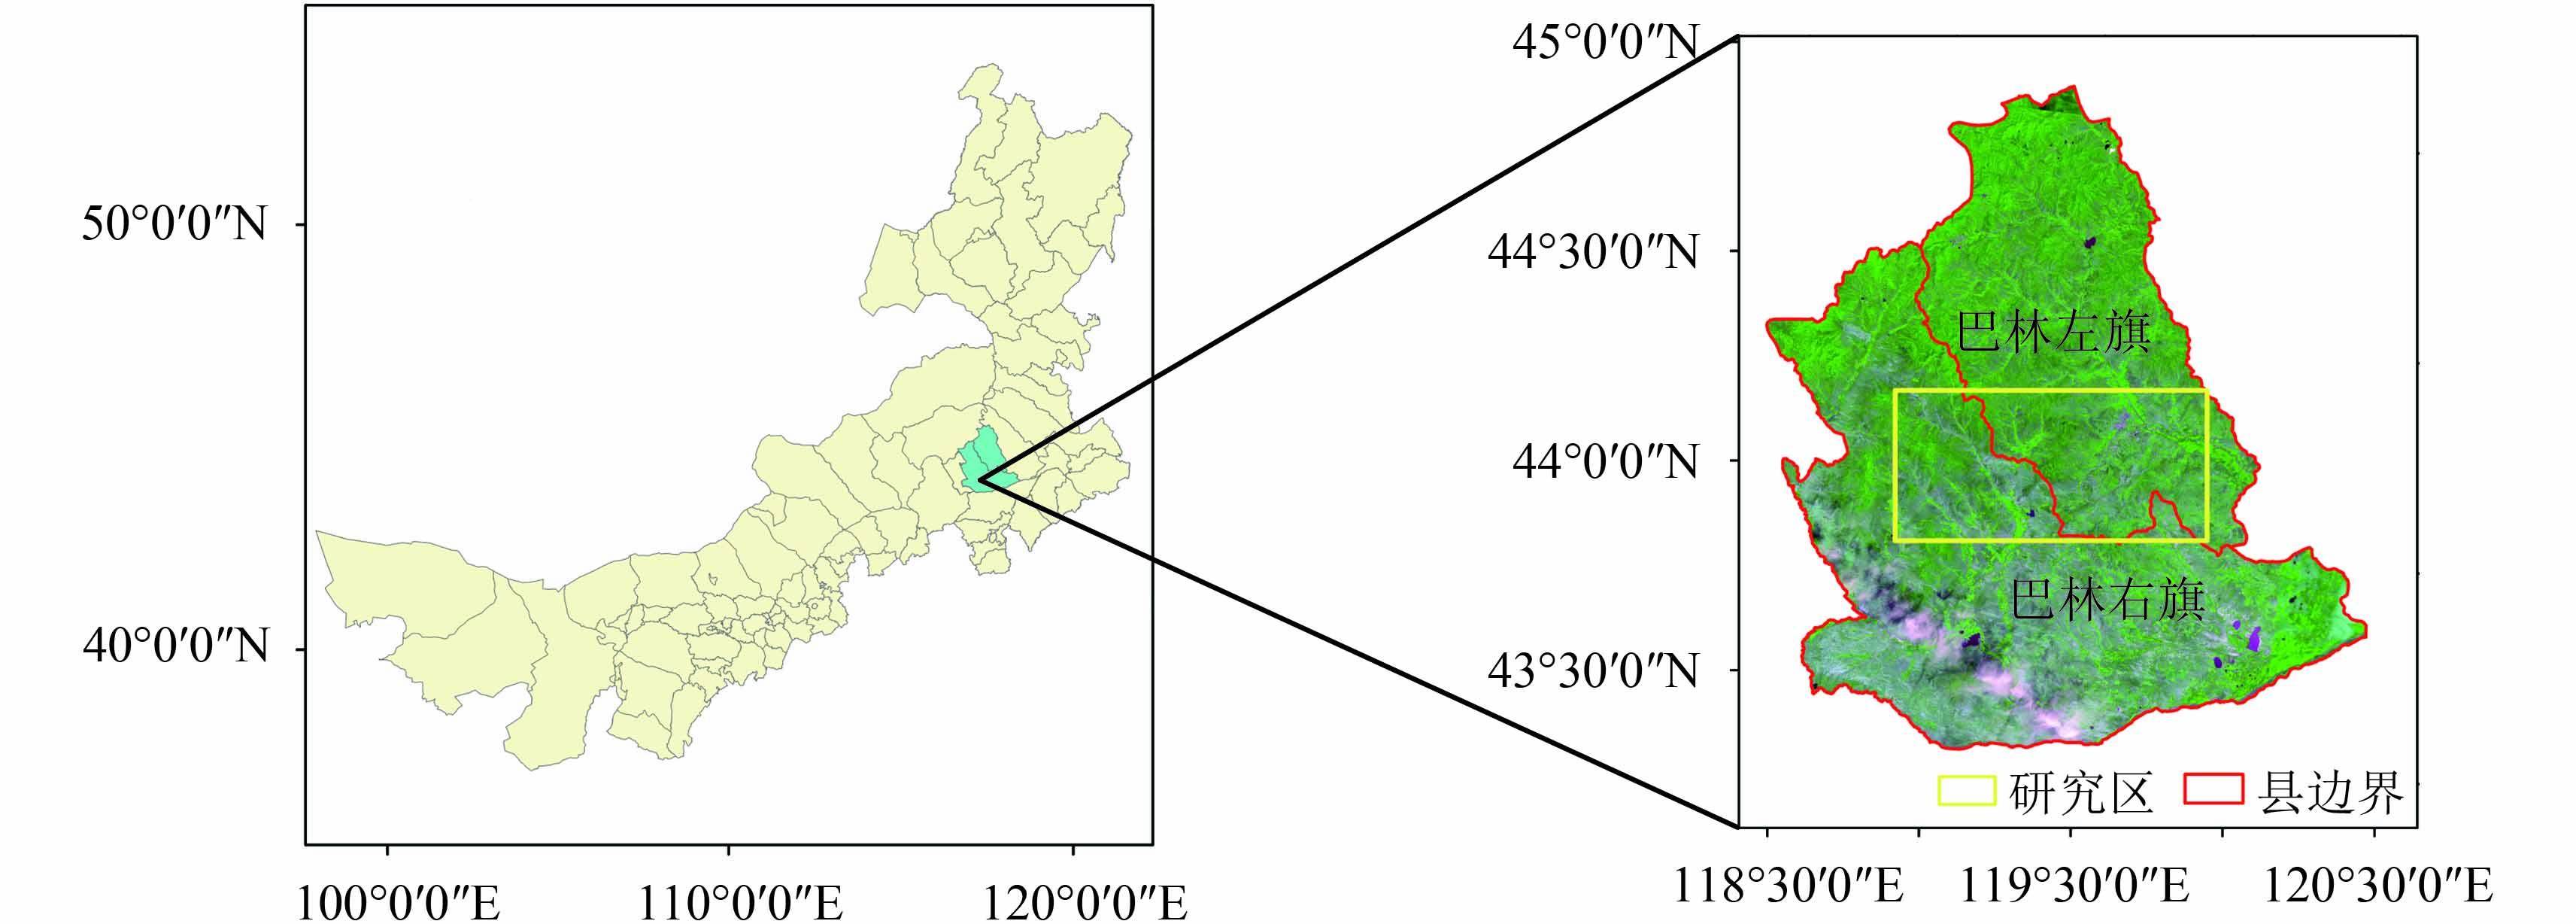 摘要:GF-4 is a geostationary satellite in the significant special space-based system of the National High-Resolution Earth Observation System. The GF-4 satellite has visible and mid-infrared bands with resolutions of 50 and 400 m, respectively. The satellite can be used to observe China and its surrounding areas and obtain patterns from continuous observation of areas with a width of 400 km by command control and with a revisit period of up to 20 s. The GF-4 satellite possesses higher spatial and temporal resolutions and achieves a more detailed observation of the Earth’s surface compared with MODIS sensors. Since the beginning of summer in 2016, Inner Mongolia, the study area, has been experiencing continuous high temperatures and rare rainfall, with its precipitation in early August being less than 10 mm, which is 80% to 100% less than normal and the lowest recorded value in history. The application of the GF-4 satellite in the rapid monitoring of large-area drought was discussed in this study. The degree of drought in the study area was evaluated. According to the collected data, no large-scale drought occurred in Inner Mongolia in 2013. During this period, vegetation grew well, and this growth was close to that in a normal year. The severe drought that occurred in Bahrain Zuoqi and Bahrain Youqi areas in Inner Mongolia Autonomous Region in 2016 was regarded as an example, and GF-4 and GF-1 data on August 14, 2016, and GF-1 data on August 10, 2013, were selected. First, the NDVI of images was calculated. Second, a quantitative analysis of GF-4 and GF-1 NDVI was conducted, and the transformation equation was obtained to eliminate the difference between different sensors. Third, the difference between the converted NDVI and normal-year GF-1 NDVI was calculated and compared with the drought distribution through the MODIS anomaly vegetation index in the same period. Finally, the drought distribution and drought degree of NDVI were analyzed. Linear transformation of the NDVI values of GF-1 and GF-4 sensors was conducted using a linear equation. According to the drought distribution in the study area in 2016, severe-drought areas were mainly distributed in the northwest part of the study area and partly distributed in the central plains. Among the drought areas, grassland was the most severe. The northeastern plains of cultivated land looked pale blue. Growth was slightly better than that in 2013, and the disaster situation was unobvious. The drought distribution trend of the GF-4 images was consistent with the drought distribution trend of MODIS NDVI, and the extent of the disaster was approximately similar. GF-4 satellite data were combined with GF-1 satellite data to monitor and analyze several arid regions in Inner Mongolia. Results show that GF-4 satellite data can be utilized to observe large areas. The satellite allows for long-term continuous observation of a region, provides real-time and continuous massive data for drought monitoring, and is important in improving emergency response capabilities.关键词:GF-4 satellite;GF-1 satellite;drought remote sensing monitoring;NDVI;Inner mongolia
- 619
- |
- 150
- |
- 13
发布时间:2021-06-07
Chinese-Built Satellite

- 摘要:The scale effect is a common phenomenon in geography that restricts the development of space science, such as remote sensing. Scale issues have elicited increasing attention from scientists due to the development of quantitative remote sensing. Developing a reasonable scaling method to promote the extensive application of remote sensing technology is urgent. In this study, existing upscaling methods in quantitative remote sensing are reviewed from two aspects, namely, pixel-to-pixel and point-to-pixel upscaling. The methods are analyzed and compared in terms of the construction, basic principles, characteristics, limitations, and applicable conditions of the corresponding models. Pixel-to-pixel upscaling methods can be divided into two types, namely, inversion–aggregation and aggregation–inversion, according to the conversion mechanism. Inversion–aggregation methods are classified as mathematics and physics based. Mathematics-based methods consist of classic image process approaches, empirical regression methods, and fractal-based methods. The principle of inversion–aggregation methods is explicit and clear, and the values acquired by such methods are generally considered true values. However, these methods require a pixel-by-pixel inversion process, which leads to low operational efficiency. Aggregation–inversion methods are categorized as input parameter-, model-, and output parameter-based approaches. Pixel-by-pixel retrieval is avoided in such methods. From the perspective of the power determination strategy, point-to-pixel upscaling methods can be classified as simple average, empirical regression, geostatistical, and Bayesian. Simple average methods depend on a reasonable evaluation of spatial heterogeneity and an efficient sampling strategy. Empirical regression methods build the empirical statistical relationship on the basis of a large amount of sample data. Geostatistical methods consider the spatial autocorrelation and spatial distribution characteristics of variables. Bayesian methods integrate high-spatial-resolution remote sensing data and prior knowledge to acquire an optimal estimation of land surface parameters at a low spatial resolution. Different point-to-pixel upscaling methods present different advantages and characteristics. Combining the temporal–spatial distribution characteristics of parameters, prior knowledge, and applicability of upscaling methods is necessary to select reasonable upscaling methods in practical applications. On the basis of this analysis, we summarize the problems in existing scaling research from four aspects, namely, discrete and continuous model, statistical and physical model, universal and targeted model, and use of prior knowledge or not. Several other problems, such as the definition of true value, uncertainty analysis, and scale domain and scale threshold determination, have rarely been discussed in upscaling research and require the attention of scientists. We also provide several possible development directions of upscaling methods in quantitative remote sensing. These directions provide important guidance to scaling theory research and its practical application.关键词:upscaling;scale effect;scale correction;validation;quantitative remote sensing
- 721
- |
- 226
- |
- 15
发布时间:2021-06-07
Review
- 摘要:Sunlight-Induced Chlorophyll Fluorescence (SICF) is an important optical probe for the investigation of the status of marine phytoplankton and has often been used to estimate chlorophyll concentration in natural waters. SICF covers the visible and near-infrared spectral range (650—800 nm) and shows two dominant peaks at approximately 685 nm (a sharp peak) and approximately 740 nm (a broad shoulder). SICF at approximately 685 nm has been widely used in the in situ measurements or remotely sensed optical imageries for the estimation of chlorophyll concentration, but it can be disturbed by complex water backgrounds. In the downwelling solar irradiance spectrum (Ed), some of the narrow troughs in the spectral range of 700—800 nm are caused by the absorption of oxygen (O2-A) in the Earth’s atmosphere. Upwelling water-leaving radiance includes the elastic backscattering signal (
$ L_{\rm{w}}^{\rm{{\small{E}}}} $ 关键词:sunlight induced chlorophyll fluorescence;ocean optic;remote sensing reflectance;Fresnel reflection;fill-in effect;O2-A band- 594
- |
- 97
- |
- 1
发布时间:2021-06-07
Fundamental Research
- 摘要:Leaf Area Index (LAI) is one of the most important forest canopy biophysical parameters and plays a key role in many forest biophysical processes and energy and matter exchange among forest–soil–atmosphere. Terrestrial laser scanning (TLS)-based Point Cloud Data (PCD) implicitly contain three-dimensional forest structural information. PCD can be used to quantitatively characterize the structural information of forests from a three-dimensional perspective and provides a high spatial resolution. Consequently, PCD provides highly detailed information about forests and enable the retrieval of forest parameters. In this study, we retrieved the canopy effective leaf area index (LAIe) by using TLS and validated the TLS-based results through field-based measurements. Three-dimensional PCD were acquired with a single- or multiple-location experimental setup in all forest plots. All PCD were clipped into a circular plot with a radius of 30 m. An algorithm called “radial hemispherical point cloud slicing (RHPCS)” was utilized to process the original PCD to retrieve the “Angular Gap Fraction (AGF)” and extinction coefficients by dividing the hemispherical volume into many “trapezoid voxels.” A “gap” voxel is an empty or a foliage voxel depending on the number of points within it. By reconstructing the normal vector of a point within a certain neighbor region, we computed the leaf mean inclination angle and obtained the canopy extinction coefficient by using Campbell’s algorithm. We calculated the LAIe of each forest plot on the basis of Beer’s law by dividing a hemisphere PCD into 9° intervals in the inclination direction. Ten annulus hemispherical regions were obtained. Each region had an azimuthal angle ranging from 0° to 360° and a 9° inclination angle range. Then, we computed the AGF, extinction coefficient, and LAIe of each hemispherical region. We obtain the LAIe of the entire plot by computing the means of the LAIe of 10 hemispherical regions. Results showed that the TLS-based LAIe captured 70.84% (N=9, p<0.01) and 74.09% (N=14, p<0.01) of the variations in LAI-2200 and Digital Hemispherical Plotography (DHP), respectively. We conducted a sensitivity analysis of laser beam angle in AGF estimation and discovered that the AGF of RHPCS should be determined based on a user-predefined laser sampling space and is affected by the characteristic size of foliage elements of a forest canopy. We also analyzed the effect of the number of neighboring points on LAIe calculation. The optimal number of neighboring points was 12 in this study, and we suggest that the number of neighboring points be based on leaf curvature when reconstructing a normal vector. Comparison of TLS-based LAIe with the LAIe results of LAI-2200 and DHP showed that calculating the LAIe of forest plots by combining TLS-based PCD with the RHPCS algorithm is feasible and suitable for forests with different densities and ages. The TLS-based LAIe estimation approach presents considerable importance in quantitatively characterizing forest canopy structural parameters from a 3D perspective.关键词:leaf area index;terrestrial LiDAR;angular gap fraction;extinction coefficient;leaf inclination
- 588
- |
- 137
- |
- 3
发布时间:2021-06-07 - 摘要:The illumination of a captured remote sensing image may be unevenly distributed because of the influences of sensors and external factors, such as light and fog. Uneven illumination degrades the quality of an image and causes interference in the subsequent processing (e.g., image interpretation, image classification, and image mosaicking). The process of correcting uneven illumination is called image dodging, which is of great practical significance and application value. Current methods focus on how to obtain the illumination distribution within an image and compensate for the different parts of the image in different degrees. The mask dodging method is widely used for remote sensing images. The background is generated by a low-pass filter to simulate the illumination distribution and subtracted from the original image to obtain the ideal image with even illumination. Estimation of the background image is a key step in the mask dodging method and directly affects the resulting image, which depends on the low-pass filter and its dimension parameter. Automatic selection of the dimension parameter is a problem in the mask dodging method. However, no suitable solution to the problem exists, and manual adjustment is usually required in practical applications. An adaptive dodging method based on a variational mask is proposed in this study to resolve the poor universality of the mask dodging method. A variational energy function is constructed according to the prior information of the image itself and the mathematical model of the mask dodging method. L1 and L2 norms are adopted to constrain the texture and detail of the ideal image and the smoothness of the background image, respectively. Estimation of the background image is transformed into an optimal solution of the variational energy function. Solving the problem directly is often difficult because the variational function contains two norms. The split Bregman method is used to decompose the variational function into three subproblems, which are solved by alternate iteration, to simplify the calculation. Optimal background and ideal images are then obtained simultaneously. Two groups of experiments are conducted on three remote sensing images to verify the effectiveness of the proposed method. Compared with mask dodging methods with three different dimension parameters, the proposed method performs better in visual evaluation and quantitative measurements. The proposed method can effectively eliminate uneven illumination while maintaining the textures and details of the remote sensing images.关键词:image dodging;variational Mask;uneven illumination;background image;split Bregman
- 560
- |
- 104
- |
- 4
发布时间:2021-06-07 - 摘要:Hyperspectral imagery (HSI) collects the detailed spectral response of ground objects on the Earth’s surface by using hundreds of narrow bands and presents a great potential for use in detecting anomalies (i.e., small and low-probability ground objects) from the main background. Sparsity theory has recently attracted increasing interest because of intelligent processing in the hyperspectral field. Many sparsity-based anomaly detection methods have been proposed in literature, and robust principal component analysis (RPCA)-based detectors are typical examples. However, regular RPCA-based anomaly detectors show that the sparse anomaly matrix should not be of low rank, and its nonzero entries should be randomly scattered in the matrix. This condition negatively affects the estimation of a low-rank background matrix and seriously impacts the effective separation between the background and anomalies in the image scene. Moreover, RPCA-based approaches involve many iteration procedures of primal variables, which leads to high computational complexity. Therefore, this study proposed column-wise RPCA (CWRPCA) to resolve these problems and improve the detection results. CWRPCA assumes that background information exists in low-dimensional randomized column subspace and possesses low-rank properties and that the anomalies are sparse and do not lie in the column subspace of the background. CWRPCA aims to decompose the HSI data matrix into the sum of a low-rank background matrix, a column-sparse anomaly matrix with small portions of nonzero columns, and a noise matrix. In this study, when the column subspace of the background was determined, anomalies were estimated from the nonzero columns of the anomaly matrix. The problem of determining the background and anomaly matrices was formulated into a convex optimization program in (2). The inexact augmented Lagrange multiplier algorithm was implemented to optimize the objective function. This algorithm introduces two auxiliary variables into the objective function and iteratively updates primal variables by fixing other variables. The low-rank background and sparse anomaly matrices were obtained when the iteration procedure terminated. The detection result was achieved by segmenting the L2 norms of column vectors in the anomaly matrix. Two HSI datasets were used to verify the detection performance of CWRPCA. The Receiver Operating Characteristic (ROC) curve and Area Under Curve (AUC) were utilized to evaluate detection performance. ROC describes the probabilities of detection and false alarm. AUC quantifies the area under the ROC curve and shows how far the ROC curve is from the baseline. The detection results of the proposed method were compared with those of five state-of-the-art anomaly detection methods, namely, low-rank and sparse matrix decomposition-based anomaly detection method, global Reed-Xiaoli method, dual window-based eigen separation transform, collaborative representation-based detector, and low-rank and sparse representation. Experimental results showed that the proposed CWRPCA outperformed the five state-of-the-art anomaly detection methods in temrs of ROC curve and AUC with a moderate computation cost. CWRPCA is better in detecting anomalies than other methods and can be a good alternative for hyperspectral anomaly detection.关键词:hyperspectral imagery;anomaly detection;robust principal component analysis;column sparse;inexact augmented Laplacian multiplier
- 613
- |
- 114
- |
- 1
发布时间:2021-06-07 -
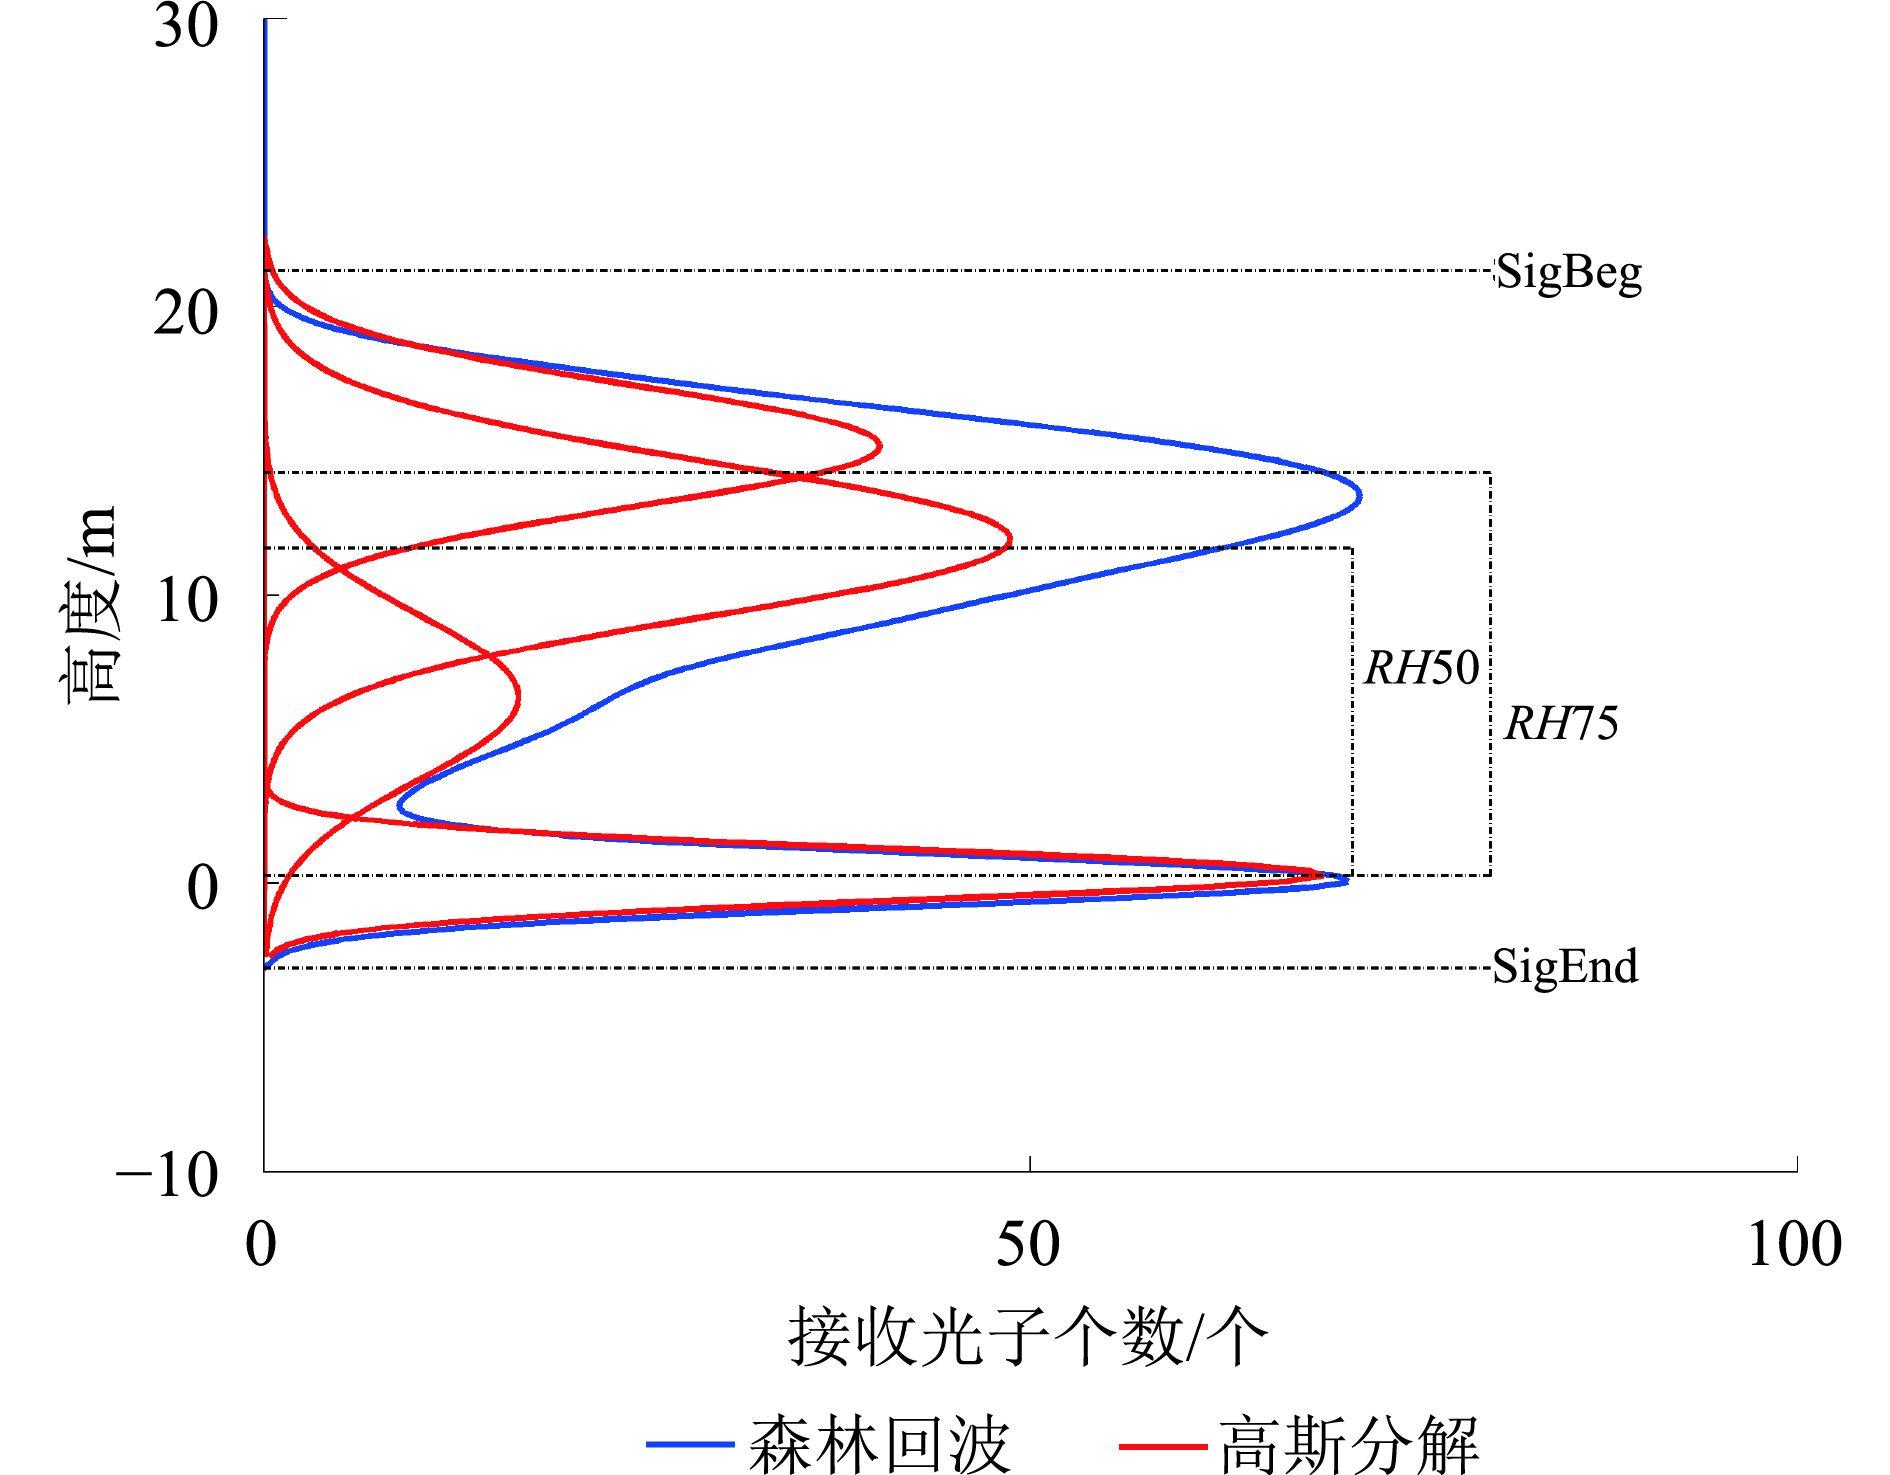 摘要:Full waveform data of large-footprint LiDAR are widely used to retrieve global or regional forest canopy heights. However, most studies have focused on forests on relatively flat terrains where the slope is smaller than 20°. Estimating the canopy height of hillside forest stands over mountainous areas with large relief remains a challenge. A model-assisted method is proposed to estimate canopy heights of hillside forest stands by using LiDAR waveforms and overcome the effect of terrains. The adaptability of the method in 0° to 40° is evaluated. We propose a new method and redefine the height index. First, the LiDAR waveform of bare ground is simulated according to given terrain slopes. Second, the LiDAR waveforms of a forest stand and bare ground are aligned according to their signal ending points. Finally, the heights of quarter energy points (i.e., H50 and H75) of the LiDAR waveform of forests are defined relative to the signal ending points, and the heights of quarter energy points (i.e., Hg50 and Hg75) of the LiDAR waveform of bare ground are defined relative to the signal ending points. The relative height indices (i.e., RH50 and RH75) of the forest LiDAR waveform are defined as the difference in the corresponding index of the simulated waveform of forest and bare ground, namely, RH50=H50 − Hg50 and RH75=H75 − Hg75. The newly defined RH50 and RH75 are used to estimate forest canopy heights. The model-assisted method is validated within 0° to 40° terrain slopes and compared with Gaussian decomposition and edge-extent methods. (1) Within the 0° to 20° terrain slopes, the accuracies of estimating forest canopy heights using Gaussian decomposition, edge-extent, and proposed model-assisted methods areR2=0.70, 0.78, and 0.98 and root-mean-square error (RMSE)=2.90 m, 2.48 m, and 0.60 m, respectively. The performance of the proposed method is slightly better than that of the two other methods. (2) Within the 22° to 40° terrain slopes, the accuracies of estimating forest canopy heights using Gaussian decomposition, edge-extent, and proposed model-assisted methods are R2=0.14, 0.28, and 0.97 and RMSE=4.93 m, 4.53 m, and 0.81 m, respectively. The proposed model-assisted method is superior to the two other methods. (3) The estimation accuracy of the model-assisted method within the 0° to 40° terrain slopes is R2=0.97 and RMSE=0.80 m. This model can overcome the effect of the terrain and maintain high accuracy. The method will be further validated using spaceborne LiDAR data in future research. The proposed method can correct the effect of slope over hillsides, and the relative height indices extracted by this method are insensitive to terrain slopes. The proposed method shows a potential for use in the accurate estimation of forest canopy heights over hillsides.关键词:lidar;terrain;waveform broadened;GLAS;forest canopy height
- 527
- |
- 129
- |
- 2
发布时间:2021-06-07 -
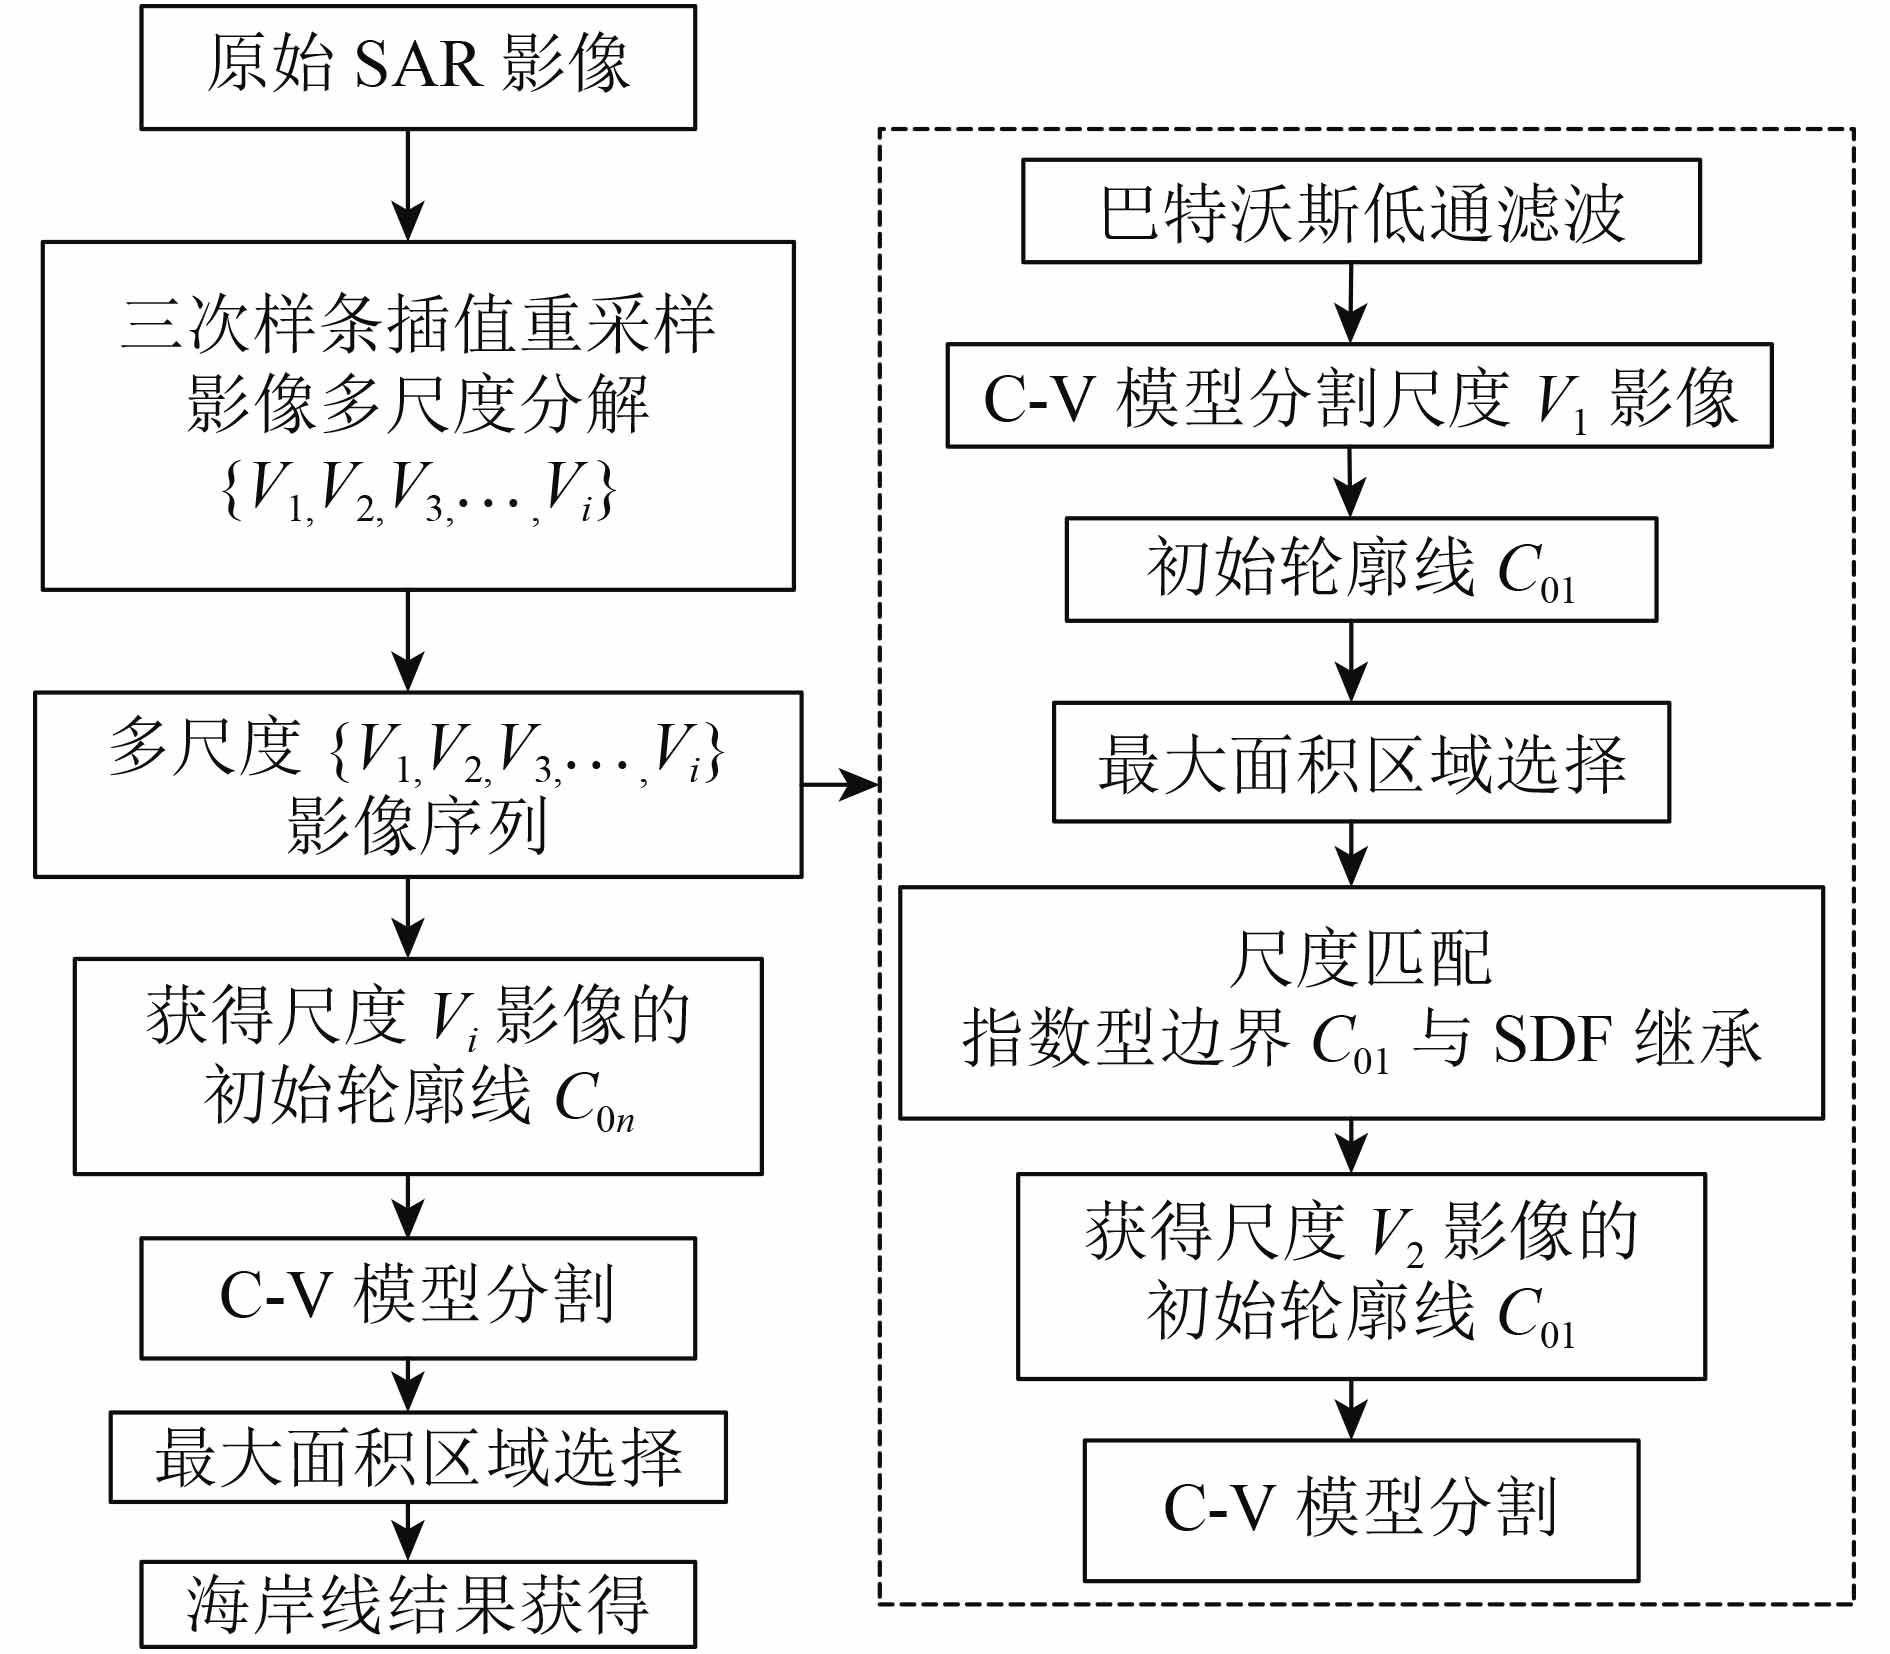 摘要:The coastline, which defines the boundary between the sea and land, is the benchmark for the division of national territory and the exclusive economic zones of oceans, and it is crucial to the maintenance of the rights to oceans. Extracting coastline information rapidly and accurately has become a popular issue in ocean research. However, detecting the coastline from SAR images is challenging because the information from land and sea can be mixed in a complex landform, and the reflection information from the sea area is changeable. The C-V model possesses strong detection sensitivity and anti-noise capability for coastline detection. However, the method involves complex iterations and large amounts of calculation. The speed of coastline detection is low for large-sized SAR images. Reducing the number of iterations and improving testing efficiency are the focus of this study, and the accuracy of the results are guaranteed under this premise. Given that the existing binary C-V model for coastline segmentation has low convergence speed and is highly sensitive to initial conditions, a novel approach using the exponential sequence of SAR images is proposed to improve the accuracy and efficiency of automatic coastline segmentation of SAR images. In this study, the image sequence generated by the traditional method is changed to an exponential sequence based on any bottom number greater than 1. The coastline is automatically detected based on predefined features from the generated image sequence. The main research techniques adopted are as follows. (1) The exponential multi-scale technology of the traditional C-V model that reduces image size and obtains a series of images under different spatial resolutions is introduced. (2) A low-pass filter is used to polish a small-scale image sequence, which is easy to form and has a relatively smooth boundary. (3) The exponential image sequence with different scales and polished degrees splits the coastline based on the C-V model of the level set one by one. In the division of the coastline, the high-spatial-resolution image inherits the boundary extracted by using low-spatial-resolution images in the high level and refines the coastline further through the C-V model. Coastline detection accuracy is ensured, and experimental results show that the computation effort of each iteration in the presented approach is less than that in the segmentation procedure based on the binary C-V model. The amount of iteration frequency is also reduced. The multi-scale method achieves image conversion from a low scale to a high scale. The low-pass filter removes small and pointless feature information, which improves the level set of the C-V model to achieve a simple iteration, significantly reduces time, and refines the boundary. The entire process ensures efficiency, high precision of edge extraction, and fast running time. Compared with the traditional binary C-V model, the presented approach is more efficient and effective in terms of computation effort and detection accuracy. Experimental results show that the presented method accelerates the acquisition of initial level set information and shortens the time of coastline extraction. The method also removes the non-coastline body and improves the detection precision of the main coastline body, thus ensuring a robust coastline detection process.关键词:SAR;exponential image sequence;coastline segmentation;multi-scale;C-V model
- 519
- |
- 76
- |
- 2
发布时间:2021-06-07
Technology and Methodology
-
 摘要:The near-surface air temperature (Ta) change in the Three Gorges Dam region (TGD) has long been a popular topic in public and research fields. However, fully capturing the spatial pattern of Ta change in TGD is challenging because of the sparse observation net and complicated topographic conditions. Thermal remote sensing technology can obtain spatially contiguous observations of Land Surface Temperature (LST) in a synoptic manner, thus providing invaluable information for spatial pattern analyses of Ta change given the fact that LST and Ta are closely related. This study aims to obtain the monthly Ta from 1979-2014 and determine its trend at a spatial resolution of 1 km. We used the satellite product of LST at nighttime (LSTnight) as a covariate in the general additive model (GAM), which incorporates spline interpolation and linear regression, to ensure high quality of Ta data. First, monthly Ta estimation accuracies estimated with and without LSTnight were compared to evaluate the contribution of LSTnight. Second, the pixel-wise Ta trend was calculated with the Mann-Kendall method, and the spatial-temporal features of the Ta trend were analyzed. Finally, the effects of elevation and tree cover on the Ta trend were assessed. The main results were as follows. (1) When LSTnight was used as a covariate in GAM, temperature interpolation accuracy dramatically improved. The improvement in the cold season was more obvious than that in the warm season because Ta in the cold season is mainly influenced by LST through a strong radiative cooling effect. (2) Inter-annual variation analysis of regional mean annual Ta in TGD revealed that pronounced warming occurred after 1997, and no significant change in Ta was observed after the water level rose to 135 m in 2003. (3) Temporal-spatial analysis of monthly Ta showed that warming occurs in almost every month (except for December), and the most dramatic warming occurs in March and September. In March, pixels with significant warming trends are mainly located in the eastern mountainous TGD, whereas in September, they are mainly located in the western TGD with a relatively flat terrain. (4) The Ta range for most months has been decreasing because the minimum temperature increased at a faster speed than the maximum temperature. Consequently, the lapse rate of Ta showed a decrease. (5) The enhanced warming trend over high elevations indicated a strong positive correlation between the trend of annual Ta and elevation (r = 0.76). However, when the elevations are similar, the warming trend is less pronounced in regions with dense tree cover, suggesting that forests can restrain warming. We conclude that LSTnight information is beneficial to Ta estimation and that the change trend of Ta in TGD shows various features depending on season, region, land cover properties, and temperature metric. Further in-depth analysis of the driving factors of the Ta trend, such as land use/cover or forest cover change, should be implemented in the future to be fully prepared to meet the challenges of climate change in TGD.关键词:Three Gorges Dam region (TGD);warming;general additive model;land surface temperature
- 461
- |
- 275
- |
- 6
发布时间:2021-06-07 -
 摘要:We used Unmanned Aerial Vehicles (UAVs) to conduct aerial surveys in the winter/spring of 2017 to determine the number and distribution of large wild herbivores and their effects on grassland ecosystems in Maduo County on the Qinghai–Tibet plateau. The effective area of the aerial surveys was 326.6 km2, and 23784 images were acquired. Interpretation tag libraries for UAV images were set up for wild animals, including Kiang, Tibetan gazelle, and blue sheep, and for livestock, such as yaks, Tibetan sheep, and horses. The population in the survey transect was obtained via the interpretation of human–computer interaction. Statistical methods based on cold- and warm-season grasslands for estimating densities and numbers were compared and verified using a synchronized ground survey and statistical data. The population estimates for kiang, Tibetan gazelle, blue sheep, domestic yak, Tibetan sheep, and horses were 17109, 15961, 9324, 70846, 102194, and 1156, respectively. The densities ranged from 1.15/km2 for kiang, 0.61/km2 for Tibetan gazelle, and 0.62/km2 for blue sheep to 7.34/km2 for domestic sheep. The ratio of large wild herbivores in sheep units to livestock in sheep units was 1∶4.5. The relationship between the distribution density of wild animals and the ecological factors of the habitat was analyzed. Kiangs preferred elevations of 4200 m to 4400 m, slopes of 2° to 5°, and grass cover of 60% to 80%. Tibetan gazelles preferred elevations of 4100 m to 4200 m or 4400 m to 4500 m, slopes of more than 5°, and grass cover of more than 80%. Blue sheep preferred elevations of 4100 m to 4200 m, slopes of more than 5°, and low grass cover. All wild species preferred areas that were close to water and far from roads. Compared with traditional ground survey methods, UAV remote sensing surveys of large wild herbivore populations are fast, economical, and reliable, and they provide an effective means to survey wild animals in the future.关键词:UAV remote sensing;Yellow River source area;large wild herbivores;population;distribution patterns
- 582
- |
- 163
- |
- 19
发布时间:2021-06-07 -
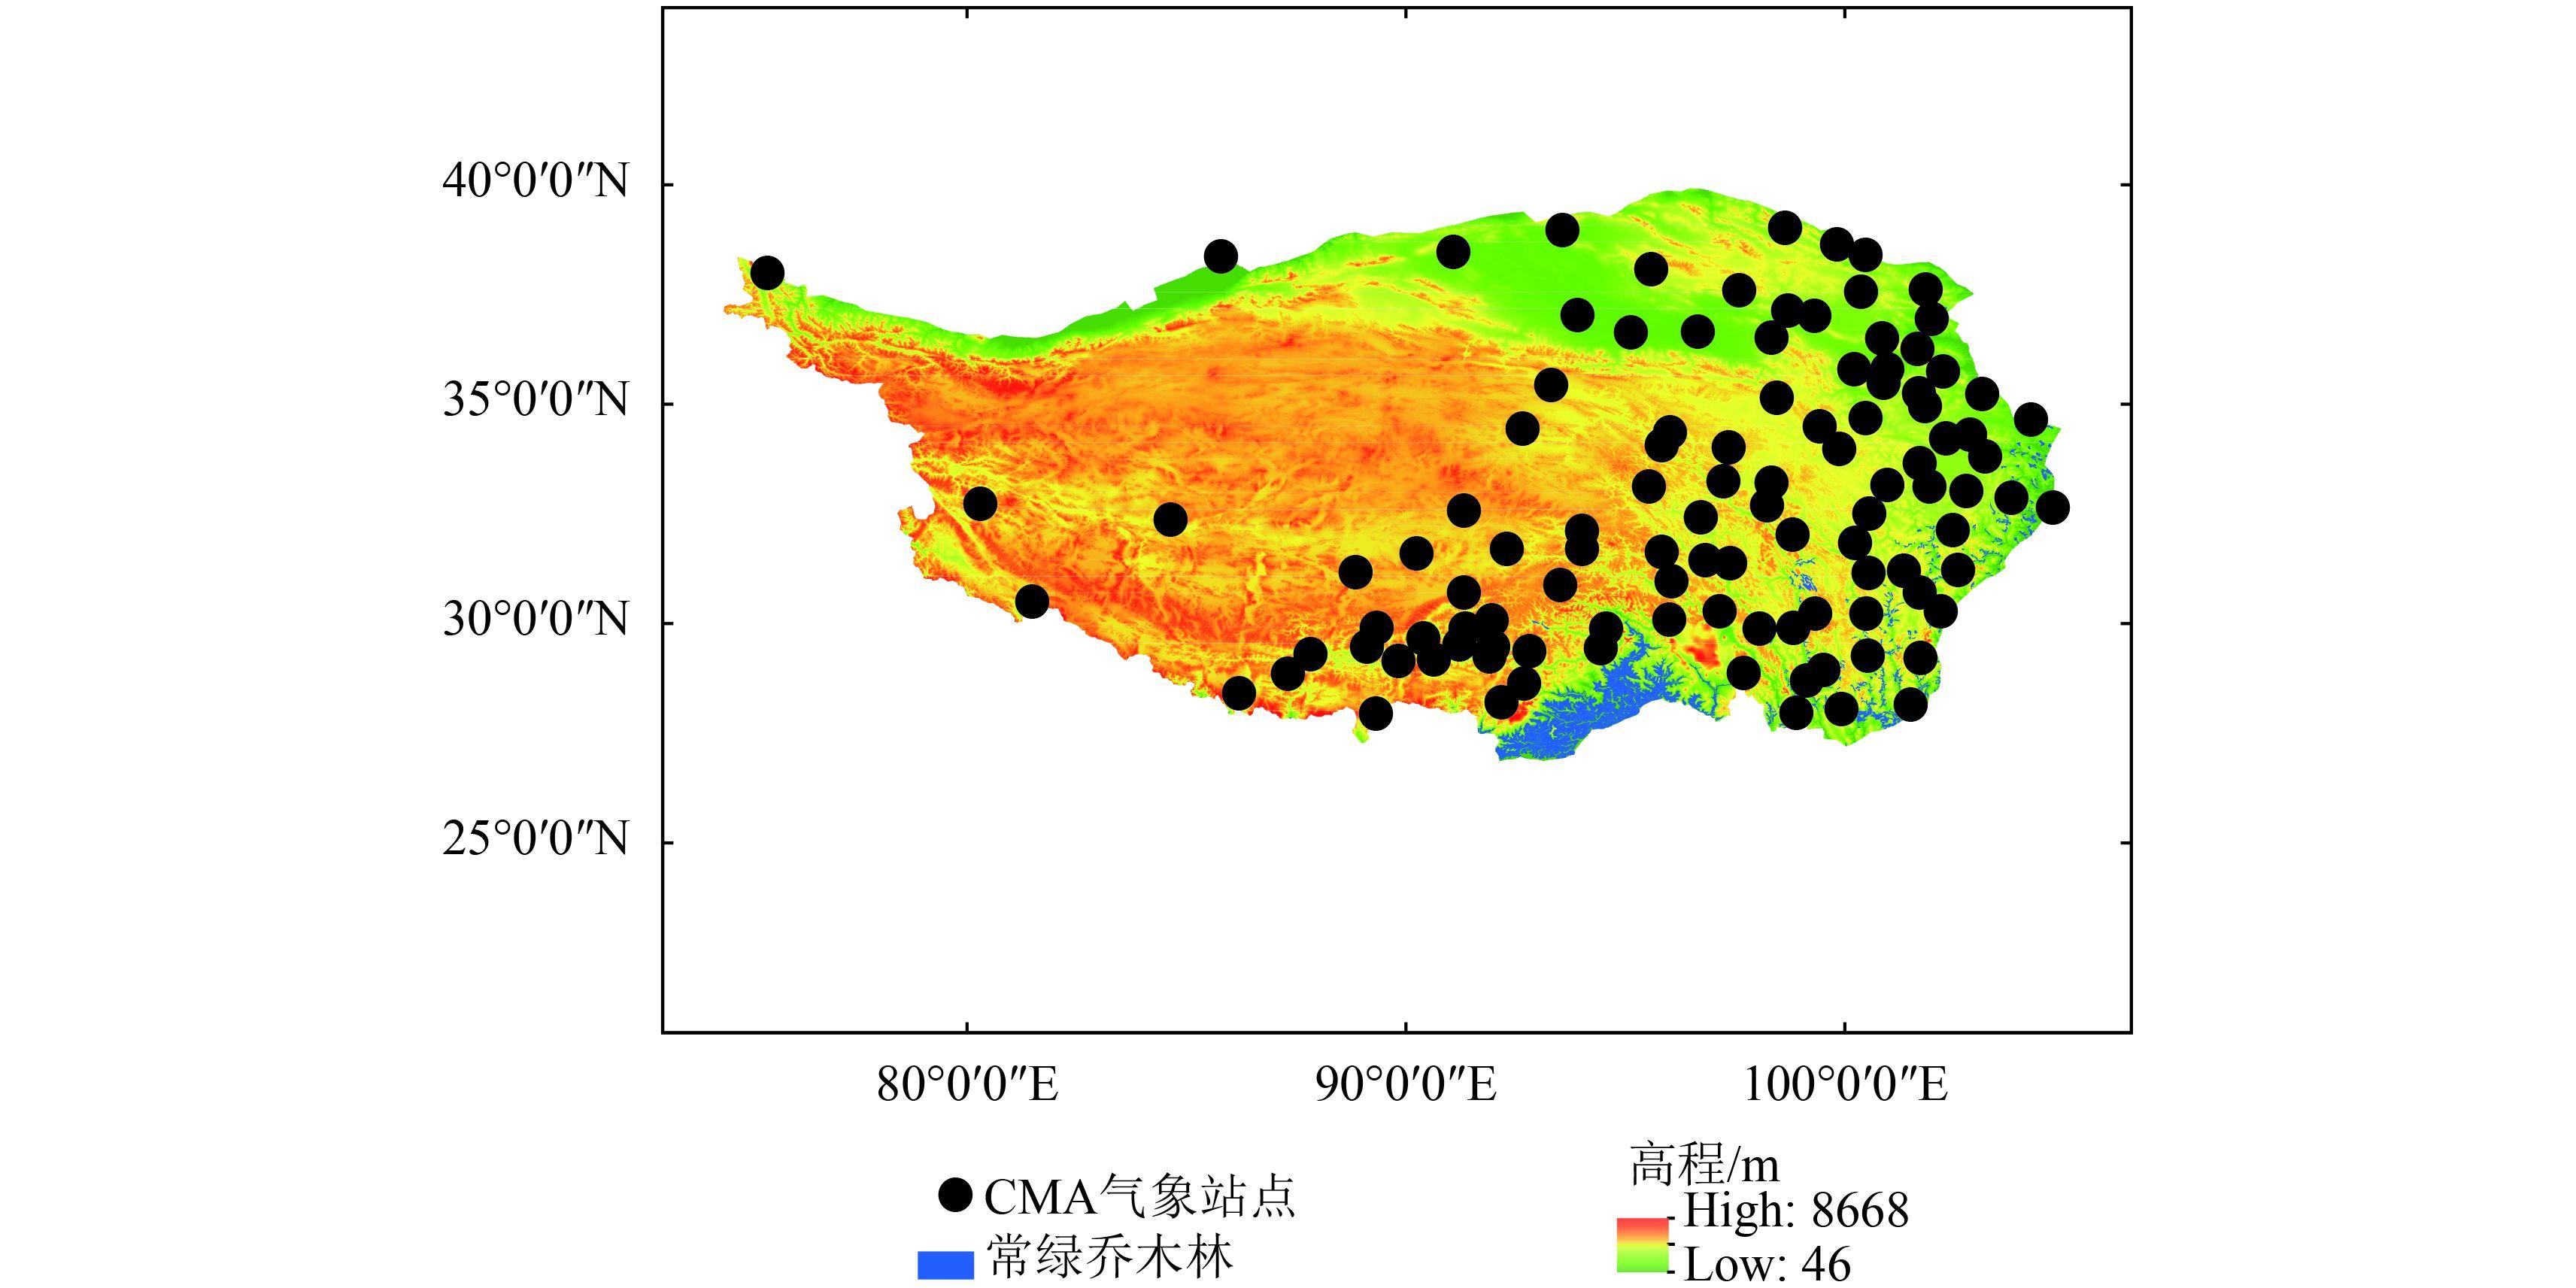 摘要:The Qinghai-Tibet Plateau is sensitive to global climate change because of its special geographical environment. Therefore, analyzing the temporal dynamics and spatial patterns of surface freeze-thaw cycles and vegetation green-up date to determine and predict their response to global climate change is important. A dual-index algorithm is adopted to obtain long-term series of surface freeze-thaw states from passive microwave brightness temperatures observed by SMMR, SSMI, and SSMIS during 1982—2013. The vegetation green-up date during 1982—2013 is derived based on the reconstructed NDVI from the GIMMS global vegetation index dataset by the filter algorithm. On the basis of both datasets, the areal extent, timing, seasonal variations, and inter-annual trend of surface soil freeze-thaw cycles and vegetation green-up date are examined across the Qinghai-Tibet plateau via regression and correlation analyses. Most pixels on the images of the Qinghai-Tibet Plateau showed the frozen state from October 30 to April 2 of the subsequent year. The average start date of surface thawing occurred mainly from May 12 to May 27, and the average green-up date occurred from May 19 to May 29. The green-up date occurred 3.94±5.58 days after the start date of surface thawing on the average, and a significant correlation exists between them (R=0.51, P=0.003). The trends for the start date of surface thawing and green-up date underwent three stages, namely, delay, advance, and delay, from 1982 to 2013. The start date of surface thawing and the green-up date were delayed at speeds of 1.93±1.81 and 0.28±1.01 days/year from 1982 to 1987, advanced at speeds of 0.67±0.20 and 0.13±0.16 days/year from 1987 to 2006, and delayed at speeds of 0.97±0.84 and 1.04±0.52 days/year from 2006 to 2013, respectively. However, the meteorological stations operated by the China Meteorological Administration indicated that the 0 cm ground surface temperature presented a continuous increasing trend, which might be caused by the changes in other environmental factors, such as heterogeneous precipitation on the Qinghai-Tibet Plateau. At the same time, the temperature threshold of vegetation green-up date showed a continuous upward trend (R=0.72, P<0.001) as air temperature increased, which was possibly correlated to the capability of vegetation to self-adapt to climate change.关键词:Qinghai-Tibet Plateau;ground surface soil freeze-thaw cycle;green-up date;climate change
- 591
- |
- 183
- |
- 4
发布时间:2021-06-07 -
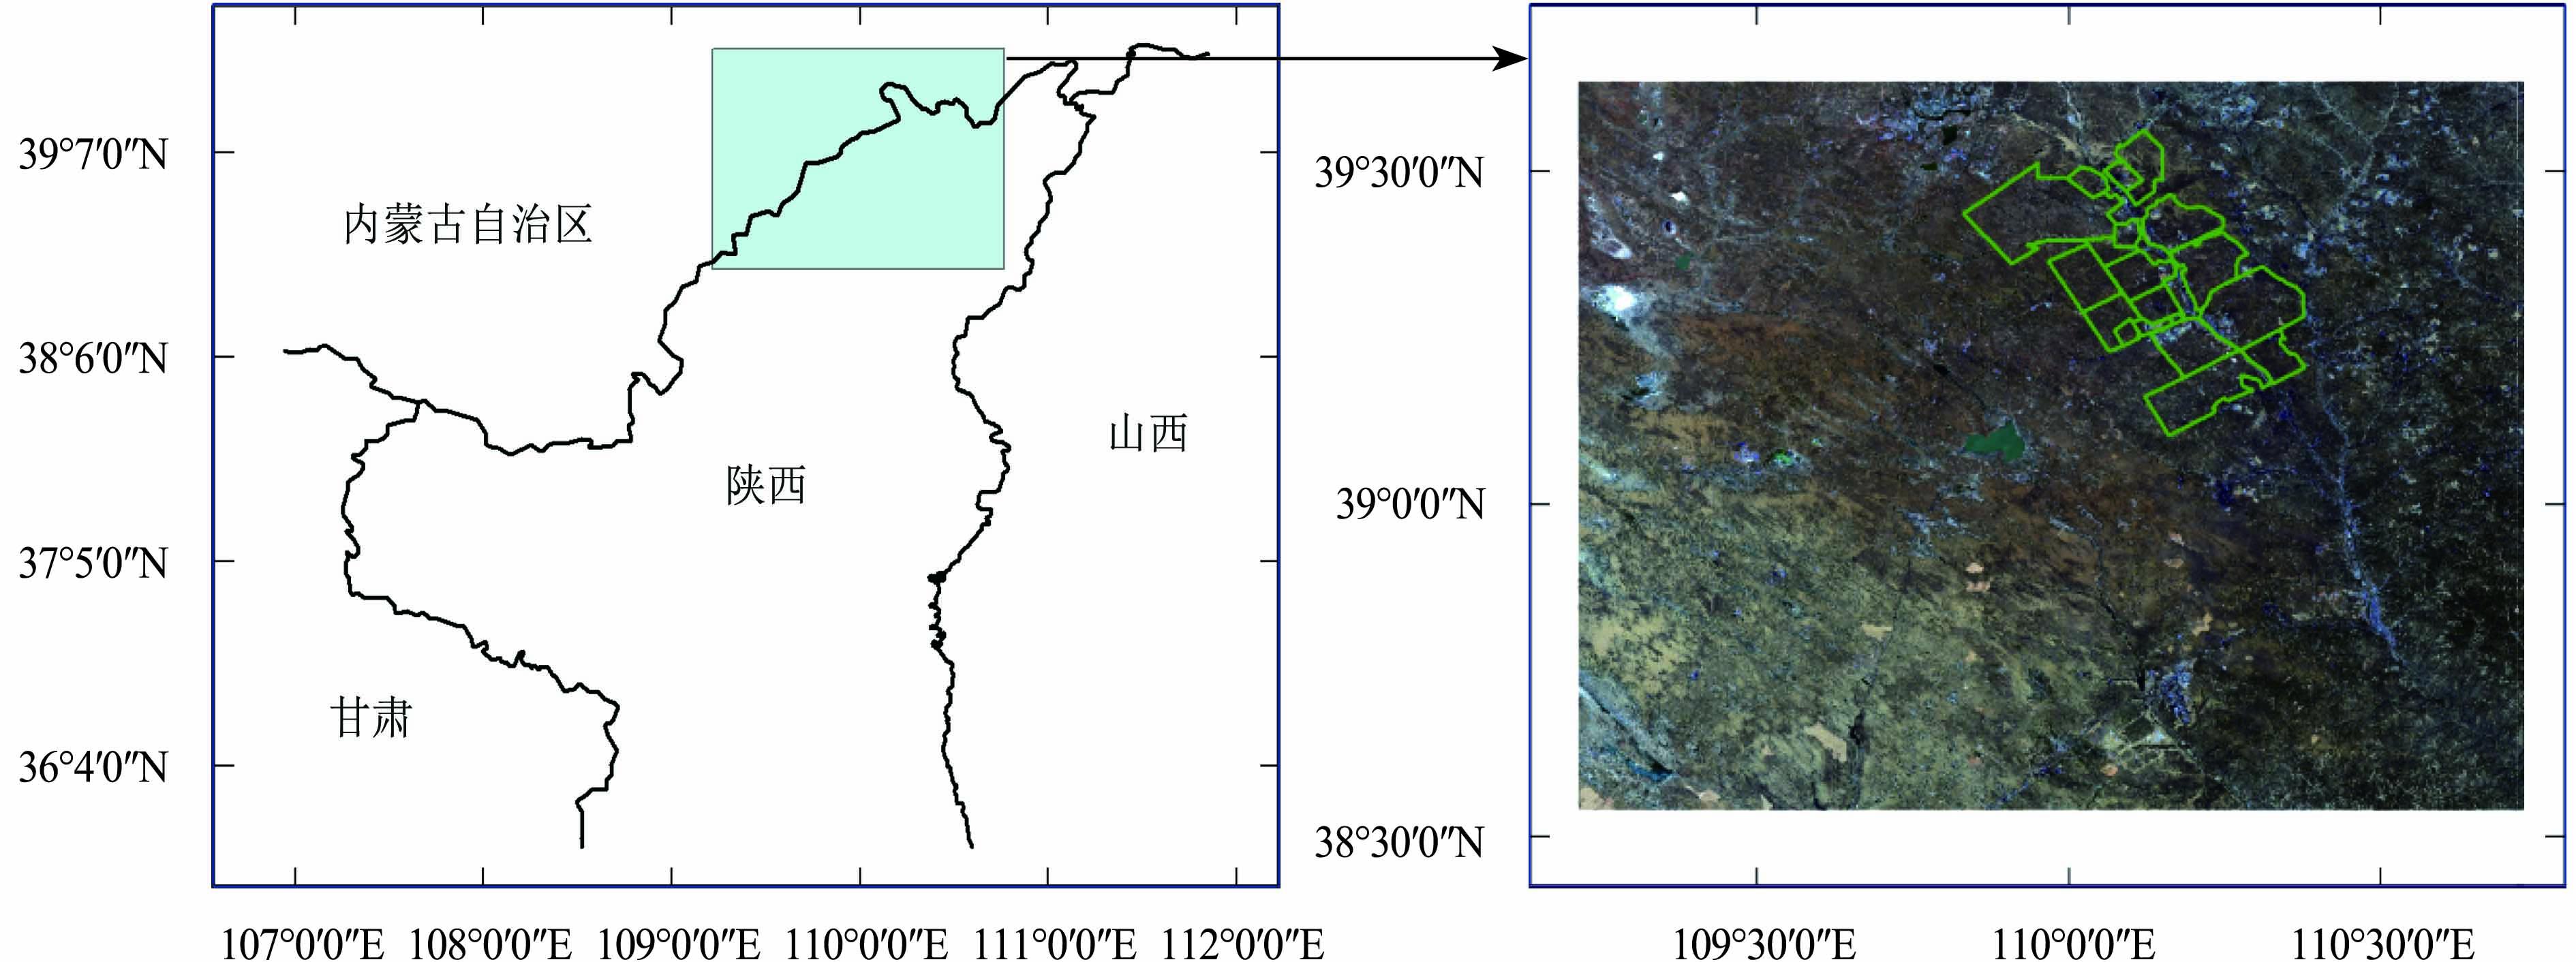 摘要:Soil moisture is a key factor that induces the deterioration of ecological environments in mining subsidence areas. In this study, a method of soil moisture inversion using Sentinel-1A dual polarized SAR and OLI surface reflectance data is proposed. First, the water content of vegetation is determined based on the normalized difference water index. Second, the effect of vegetation on the Sentinel-1A backscattering coefficient is eliminated by using the water cloud model, which has been transformed into the backscattering coefficient of bare soil. Third, based on the empirical model established by AIEM and Oh models, the surface parameters of the study area are determined and verified by the OLI optical inversion results. Finally, the soil moisture contents in the subsidence and non-subsidence areas are compared. (1) Compared with the results of soil moisture based on the soil moisture monitoring index, the VH-polarized inversion results exhibit better agreement between two polarization patterns. Moreover, the inversion results of two polarization patterns simultaneously show that the inversion result of the desertification grassland area is better than those of loess hilly and gully regions, which indicates that the effect of terrain on the backscatter cannot be ignored. (2) In the 72 sets of data during 2016, the VH-polarized inversion results show that the soil moisture content in the comparative area is larger than that in the subsidence area; it accounts for 41 cases, and the proportion is 57%. Meanwhile, the VV-polarized inversion results show that the soil moisture content in the comparative area is larger than that in the subsidence area; it accounts for 36 cases, and the proportion is 50%. In addition, subsidence in different mining areas is affected differently. Results indicate that the increase in surface roughness caused by mining subsidence exerts a negative effect on surface soil moisture. However, differences exist between different mining areas.关键词:polarimetric radar;soil moisture;interferometry synthetic aperture radar(InSAR);mining subsidence;time series
- 555
- |
- 94
- |
- 4
发布时间:2021-06-07
Remote Sensing Applications
- Postal code:100190
- Tel:010-58887052 Email:nrsb@aircas.ac.cn
- Technical support is provided by Beijing Founder electronics co., LTD 京ICP备20021838号-9
 京公网安备11010802024621
 - It is recommended to read the content of this site in Chrome&IE9+. Please switch to extreme mode in browser 360.
- Cookies We use cookies to help provide and enhance our service and tailor content. By continuing, you agree to the use of cookies.

0